
DOI: https//doi.org/10.13037/gr.vol36n109.5707
|
Received: 01/11/2018 | Accepted: 04/02/2020 |
Brazilian state distribution: an analysis based on performance in innovations
|
Elaine Vaz[1] Orcid: https://orcid.org/0000-0002-9865-2693
|
Adriana Kroenke[2] Orcid: https://orcid.org/0000-0002-9865-2693 |
|
Daniela Ferrari[3] Orcid: https://orcid.org/0000-0001-6625-3017 |
Bianca Aparecida Grubert Gonçalves de Araújo[4] Orcid: https://orcid.org/0000-0002-2470-7815 |
Abstract
The present article aimed to verify the distance between the Brazilian states based on the state performance in innovations. In this sense, the proposal consists in presenting the spatial redistribution of the Brazilian states based on the sum of their potential (innovation capacity) and their results (innovative performance). To reach such a goal, the study conducted a macroeconomic analysis of the country using secondary data available in government databases and other related organizations. Multidimensional scaling and conglomerate analysis were applied. The study was classified as descriptive, documentary and quantitative. The results showed that the factors determining the innovation capacity of the Brazilian states and the innovative performance present different stages of development, which explains the different performances achieved by states of a same geographical region.
Keywords: Innovation. Innovation Capacity. Innovative Performance.
1 INTRODUCTION
Among the factors that stimulate the competitive capacity of organizations and countries, the production and diffusion of innovations stands out (LALL, 2001; TÖDTLING; TRIPPL, 2005). Therefore, due to the representativeness of innovative activity, as one of the main references of economic growth (GRUPP; MOGEE, 2004; GRUPP; SCHUBERT, 2010), different studies have addressed the phenomenon of innovation. There are publications that describe the types of innovation (OECD, 2006), identify the factors
that make up the capacity for innovation (KOC, 2007; KOC; CEYLAN, 2007; PRAJOGO; AHMED, 2006), and study the national innovation systems (FURMAN; PORTER; STERN, 2002).
Among the studies that sought to identify the determinants of innovation at the microeconomic level, for example, Pavitt (1984) argued that research and development (R&D) activities in technology-based companies correspond to the main determinant of innovation. However, Cohen and Levinthal (1990) consider the quality of human capital as a determining factor, as it reflects the organization's capacity to absorb, assimilate and develop new knowledge and technologies. In addition to these, there are studies that consider internal communication channels (AIKEN; HAGE, 1971), decentralized structure (DAMANPOUR, 1991) and culture and environments favorable to innovation (PRAJOGO; AHMED, 2006) as key elements.
On the other hand, at the macroeconomic level, the innovation process is analyzed through a set of variables that simultaneously influence both inputs and outputs and performance in innovations (CARLSSON et al., 2002; EDQUIST, 2001). Thus, together with the influence of variables such as R&D, human capital, infrastructure and financial resources, the interactions between these variables in the innovation process are considered (FURMAN; PORTER; STERN, 2002; LUNDVALL, 2007).
In this sense, from the perspective of Innovation Systems (SI), the ability to innovate has come to be considered the main vector of development and socioeconomic growth (KAMASAK, 2015), serving as a basis for countries to achieve superior economic performance (FERREIRA; DIONÍSIO, 2016). And, as a result, it has been common to use science, technology and innovation as indicators (CT&I) to measure the innovative performance of countries (GRUPP; MOGEE, 2004; GRUPP; SCHUBERT, 2010).
Based on this, Alexe and Alexe (2016) highlight that, in addition to allowing the comparison of performance between different organizations, through the use of individual scores, extracted from already consolidated indexes, it is possible to recognize and delimit the importance of the determining factors of innovation. However, amid a diversity of indicators that assess results and performance in innovations, a large part of the indexes focus on analyzing countries or socioeconomic blocs composed only by developed countries. Based on the above, there is the following research problem: what is the distance between Brazilian states, based on state performance in innovations?
When identifying the need to expand the studies on innovations in the Brazilian context, the present work intends to verify the distance between Brazilian states, based on these states’ performances in innovations. From a macroeconomic analysis of the country, using secondary data on infrastructure, business environment, education, qualification of the population and professionals, HDI, patents, technical and scientific production, and industrial and export performance, available in the databases from government data and other related organizations, we seek to assist public decision makers in the process of elaborating and institutionalizing appropriate socioeconomic policies for the promotion of national innovation.
Structured in five sections, this study has its theoretical framework focused on the following themes: innovation, capacity for innovation and performance in innovation. After the theoretical framework (section two), the methodological research procedures adopted for the preparation and conduct of this work are presented. Then, there is the presentation and discussion of the results obtained. Finally, section five presents the final considerations of this work, including the limitations of the research and the suggestions regarding future studies. The references used are available at the end of the final considerations.
2 THEORETICAL FRAMEWORK
This section intends to explore the concepts used in this work. Initially, the usual definitions of literature for the phenomenon of innovation are presented; next, the elements that make up the capacity for innovation are discussed and; finally, it discusses the approaches used to measure the innovation performance of organizations and countries.
2.1. Innovation
The understanding of the innovation phenomenon has been proposed in a multifaceted way, that is, characterized from different perspectives (GARCIA; CALANTONE, 2002). Varying according to the researcher's position, innovation can be understood in different ways. Unanimity in relation to the concept of innovation is its novelty characteristic, whether for the company, for the market or for the world (GARCIA; CALANTONE, 2002; MORTENSEN et al., 2005).
However, it was from Schumpeter's (1934) ideas that innovation was studied more deeply. For the author, innovation can be understood as the combination of resources aimed at the production of new products; for the production of existing products, produced using new production techniques and; for entering new markets. In this way, innovations can be classified into two respective groups: radical innovations and incremental innovations. Radical innovations are understood as innovations resulting from the process of creative destruction, which result in something new and can be represented by a product or process. Incremental innovations, in turn, correspond to innovations made in existing objects (SCHUMPETER, 1934).
From another perspective, Grupp (1998) defines innovation as a consequence of the development of science and technology, visualized through research and development (R&D) activities. Others define innovation as a process that involves creativity during its development and uncertainties regarding its results (HU, 2003; SANTOS et al., 2014). For Bartel and Garud (2009), innovation is the process of generating ideas, which, based on past experiences, seeks to solve future problems.
In addition, innovation can also represent the elaboration of something new, add value to artifacts considered obsolete, or even modify the way something old is realized. Consequently, activities generated from an innovative idea, will result in better activities (BASKARAN; MEHTA, 2016; DAWE, 2004; LAZONICK, 2004).
The Oslo Manual (OECD, 2006), defines innovation as the implementation of a new or improved product (good or service), a process, a marketing method, or a new organizational method for business inside and outside the organization. The minimum requirement for a definition of innovation is that the product, process, marketing or organizational method be whether new or in process of improving the organization. This can range from products, processes and methods that are considered pioneers to those that have already been adopted by companies (OECD, 2006).
In this sense, organizations can generate or adopt innovations, and when they decide to generate them, they can use them for their own benefit or to supply the market (DAMANPOUR; WISCHNEVSKY, 2006; HOLLEN; VAN DEN BOSCH; VOLBERDA, 2013). Whether generated or adopted, innovations contribute from the high performance of companies from increasing competitiveness to the stimulus to improve the standard and quality of life, transforming all spheres of society (GOPALAKRISHNAN; DAMANPOUR, 1997; LAZONICK, 2002; WALKER; CHEN; ARAVIND, 2015).
2.2 Capacity for Innovation
Originally proposed by Villa (1990), in the territorial perspective, the capacity for innovation aims to measure the inventions and the innovative potential of countries. In the organizational context, the capacity for innovation is characterized by the continuous improvement of organizational skills in developing new products, whether goods and / or services (SZETO, 2000). In this sense, the capacity for innovation comprises the attributes that the organization needs to develop to support innovation activities (KOC, 2007).
According to Rejeb et al. (2008), the capacity for innovation is related to a set of skills, knowledge, tools and financial resources. For Tekin and Tekdogan (2015), the capacity for innovation is a critical dimension for economic development, with certain factors such as culture, skills and organizational structure. Thus, as the capacity for innovation involves multiple factors, these elements must be managed in a cohesive and integrated manner, taking into account various impact factors, such as technology, R&D, production methods and techniques, organizational structure and culture, and human resources, which must be managed in a synchronized manner (DERELI, 2015; PRAJOGO; AHMED, 2006).
Thus, composed of different elements, such as technology, research and development (R&D), production methods and techniques, organizational structure and culture, human and financial resources (DERELI, 2015; PRAJOGO; AHMED, 2006), the capacity for innovation depends on the variety and structure of the relationship with sources of information, knowledge and technologies (AHUJA, 2000). Therefore, aiming at positive results, these elements must be managed in a synchronized and harmonious manner, establishing favorable conditions for innovation (DERELI, 2015; REJEB et. Al., 2008; PRAJOGO; AHMED, 2006).
For this reason, the measurement of innovation capacity is characterized as multifactorial, thus requiring a set of indicators from various perspectives (BOLY et al., 2013). Among the indicators commonly used to measure innovation capacity, investments made in Research and Development (R&D) are the most common of them (BALCOMBE; BAILEY, FRASER, 2005). It is through the identification of factors that promote or restrict the capacity for innovation in a society that countries can increase economic and social well-being (TEKIN; TEKDOGAN, 2015).
2.3 Performance in Innovation
According to Mahroum and Al-Saleh (2013), innovation has become a political priority for many nations and has assumed a prominent role when composing national development strategies and presenting significant budgets. Some countries have even established ministries, departments and offices focused on promoting and fostering innovation and innovation policies. Thus, in order to analyze the effectiveness of government action, several innovation indexes have been developed to measure and evaluate innovation performance at national and subnational levels. From those, the following stand out as most prominent: European Innovation Scoreboard; OECD Science, Technology and Industry Outlook; Nordic Innovation Monitor; the indexes prepared by the United Nations Conference on Trade and Development (UNCTAD); and the World Bank.
In addition to the indexes cited by Mahroum and Al-Saleh (2013), the following innovation indexes stand out worldwide: The Global Competitiveness Report, prepared by the World Economic Forum; Innovation Index Global, prepared by Samuel Curtis Johnson Graduate School of Management - Cornell University, together with INSEAD Business School and the World Intellectual Property Organization (WIPO); Bloomberg Innovation, prepared by Bloomberg L.P .; The International Innovation Report, prepared by the Boston Consulting Group, in partnership with The National Association of Manufacturers (NAM) and The Manufacturing Institute (MI); IMD World Competitiveness Yearbook, prepared by the International Institute for Management Development (IM) and; Contributors and Detractors: Ranking Countries' Impact on Global Innovation, prepared by the Information Technology & Innovation Foundation (ITIF).
The innovation indexes are concentrated on two main aspects: the creation of new knowledge and the exploitation of this new knowledge and innovations. Based on this focus, the innovation model assumes a relationship between process inputs and outputs, such as product research and development (OECD, 2006). For Katz (2006), performance indicators such as GDP, technological intensity, investments in R&D and scientific impact (number of citations), for example, are used in order to compare innovation systems, and are sometimes used to classify the members of an innovation system and to assist them in making decisions.
Therefore, due to the representativeness of the innovative activity, considered one of the main indicators of economic growth, it is essential to measure innovation at a national level. Through the evaluation of results in innovations, nations can institute public policies that stimulate innovation in a targeted manner towards areas of perceived national need (GRUPP; MOGEE, 2004; GRUPP; SCHUBERT, 2010).
3 METHODOLOGICAL PROCEDURES
This study seeks to verify the distance between the Brazilian states, based on state performance in innovations. In this sense, the purpose of this research is to present the spatial redistribution of Brazilian states from the sum of their potential (capacity for innovation) and their results (innovative performance). Thus, this study is classified as descriptive, documentary and quantitative.
The research is descriptive, as it describes both the dimensions and variables considered by these indicators, as well as those that make up the proposed model for the analysis of the performance in innovations of the Brazilian states. Cervo and Bervian (2002) conceptualize descriptive research as the research technique that only observes, records, analyzes and correlates the facts or phenomena without manipulating them.
Meanwhile, regarding the objectives, this study is still classified as documentary, defined by Silva and Grigolo (2002) as the type of research that selects, treats and interprets raw information through the available data and information, as it seeks to compose a new list of information on the phenomenon of innovation in Brazilian states.
Using statistical techniques for data handling, processing and analysis, this research is considered quantitative. According to Richardson (1999, p. 70), quantitative research “is characterized by the use of quantification both in the modalities of information collection and in the treatment of them through statistical techniques, from the simplest [...] to the most complex [...] ”.
For the stage that precedes the distribution of the Brazilian states based on their innovative performance, it was necessary to develop an index for the evaluation of the innovation capacity of the Brazilian states (encompassing several variables that encourage, promote and sustain the innovative activity) and an index for analyzing the respective results in innovation (composed of different variables that contemplate the results obtained). These indicators, together, correspond to the Innovation Performance Index of the Brazilian States. Table 01 below illustrates how the innovation capacity index that was applied to Brazilian states was structured.
Table 1 - Innovation Capacity Index (dimensions, variables and sources)
|
Dimension |
Variable |
Source |
|
Infrastructure |
Electricity fee |
Brazilian National Confederation of Industry (CNI – in Portuguese) |
|
Business environment |
Taxes collected Industry employment Economically active population (EAP) |
Brazilian National Confederation of Industry (CNI – in Portuguese) Atlas of Human Development in Brazil |
|
Investments in Research, Science and Technology |
Investments in Science & Technology (S&T) Coordination for the Improvement of Higher Education Personnel (CAPES – in Portuguese) investments in scholarships National Council for Scientific and Technological Development (CNPq – in Portuguese) investments in scholarships Promotion of research Post-graduate scholarships Access to the journals portal |
Ministry of Science, Technology, Innovation and Communication (MCTI – in Portuguese) Coordination for the Improvement of Higher Education Personnel (CAPES – in Portuguese) National Council for Scientific and Technological Development (CNPq – in Portuguese) |
|
Formal Quality of Higher Education Institutions |
Basic Education Development Index (IDEB – in Portuguese) Grade General Course Index National Student Performance Exam (ENADE – in Portuguese) |
National Institute of Educational Studies and Research Anísio Teixeira (Inep – in Portuguese) |
|
Illiteracy and School Vulnerability |
Illiteracy rate School vulnerability rate |
Atlas of Human Development in Brazil |
|
School Attendance |
Primary school attendance High school attendance Higher education attendance |
Atlas of Human Development in Brazil |
|
Population Qualification |
Population with primary education Population with high school education Population with higher education Postgraduate education |
Atlas of Human Development in Brazil |
|
Qualification of Professionals |
Employees with elementary education Employees with high school education Employees with higher education |
Atlas of Human Development in Brazil |
|
Human development |
Relative Human Development Index (HDI) |
Atlas of Human Development in Brazil |
Source: research data.
Subsequently, the presentation of the innovation capacity index, with its respective dimensions and variables, is presented in Table 2, contemplating the structure of the innovation results index of the Brazilian states.
Table 2 - Innovation Outcome Index (dimensions, variables and sources)
|
Dimension |
Variable |
Source |
|
Industrial Performance |
Participation of manufactured goods in State’s exports Participation of industrialized goods in State's exports Industry share in the State's GDP State participation in industrial GDP GDP - millions (gross value added) |
Brazilian National Confederation of Industry (CNI – in Portuguese)
|
|
Patents |
Technology contracts Industrial designs Geographical indications Brands Invention patent Utility model patent Patent addition certificate Computer programs |
The National Institute of Industrial Property (INPI – in Portuguese) |
|
Scientific production |
Total Authors Articles published in national journals Articles published in international journals Papers published in event annals Published books Published book chapters Other bibliographic publications |
National Council for Scientific and Technological Development (CNPq – in Portuguese) |
|
Technical Production |
Total Authors Software (with registration or patent) Software (without registration or patent) Technological Products (with registration or patent) Technological Products (without registration or patent) Processes or techniques (with catalog / registration) Processes or techniques (without catalog / registration) Technical papers Paper Presentations Others |
National Council for Scientific and Technological Development (CNPq – in Portuguese) |
|
Completed Guidelines |
Total advisors Doctoral theses Master's dissertations Improvement and/or specialization course monographs Under graduation end-of-course paper Scientific research |
National Council for Scientific and Technological Development (CNPq – in Portuguese) |
|
Export Performance |
Export Volume (US$ FOB) Number of Destination Countries |
Ministry of Development, Industry and Foreign Trade (MDIC – in Portuguese)
|
Source: research data.
After data collection, the data standardization procedure was performed. This procedure was necessary to uniformly proportionalize and secure the different quantities on a single scale. Thus, the data collected were standardized on an interval scale of five points (from zero to five).
Table 01 presents the score of the innovative performance of the states, which present the state results in innovation, through a scale ranging from zero to ten.
|
# |
State |
Score |
# |
State |
Score |
# |
State |
Score |
|
1st |
Santa Catarina (SC) |
9,49 |
11 th |
Roraima (RR) |
6,88 |
21 th |
Piauí (PI) |
5,45 |
|
2nd |
São Paulo (SP) |
9,46 |
12 th |
Sergipe (SE) |
6,88 |
22 th |
Alagoas (AL) |
5,42 |
|
3rd |
Distrito Federal (DF) |
9,20 |
13 th |
Amazonas (AM) |
6,62 |
23 th |
Pará (PA) |
5,31 |
|
4th |
Rio Grande do Sul (RS) |
9,12 |
14 th |
Paraíba (PB) |
6,51 |
24 th |
Amapá (AP) |
5,25 |
|
5 th |
Paraná (PR) |
8,61 |
15 th |
Pernambuco (PE) |
6,47 |
25 th |
Maranhão (MA) |
4,85 |
|
6 th |
Rio de Janeiro (RJ) |
8,54 |
16 th |
Mato Grosso (MT) |
6,38 |
26 th |
Rondônia (RO) |
4,79 |
|
7 th |
Mato Grosso do Sul (MS) |
8,10 |
17 th |
Ceará (CE) |
6,27 |
27 th |
Acre (AC) |
4,60 |
|
8 th |
Minas Gerais (MG) |
7,59 |
18 th |
Goiás (GO) |
6,26 |
|
|
|
|
9 th |
Espírito Santo (ES) |
7,22 |
19 th |
Bahia (BA) |
5,83 |
|
|
|
|
10 th |
Rio Grande do Norte (RN) |
7,01 |
20 th |
Tocantins (TO) |
5,53 |
|
|
|
Source: research data.
After the final calculation of the innovation coefficients of the Brazilian states (individual results of the innovation capacity index added to the respective results of the innovation results index), the spatial redistribution of the Brazilian states was performed using the multidimensional scaling statistical technique (Multidimensional Scaling - MDS), carried out using the SPSS® Statistics 21.0 statistical software. Hair Jr. et al. (2009, p.423), comments that “multidimensional scaling [...] allows a researcher to determine the relative perceived image of a set of objects [...] in terms of similarity or preferences [...] over distances represented in multidimensional space.”
Then, for the interpretation of the spatial distribution of Brazilian states, derived from multidimensional scaling, cluster analysis was used "whose primary purpose is to aggregate objects based on the characteristics they have" (HAIR JR. Et al., P .384, 2009). According to the author, “the resulting groupings [...] must exhibit high internal homogeneity and high external heterogeneity. Thus, [...] the objects within the groupings will be close when represented graphically and different groups will be distant” (HAIR JR. Et al., P.384, 2009).
4 PRESENTATION AND ANALYSIS OF RESULTS
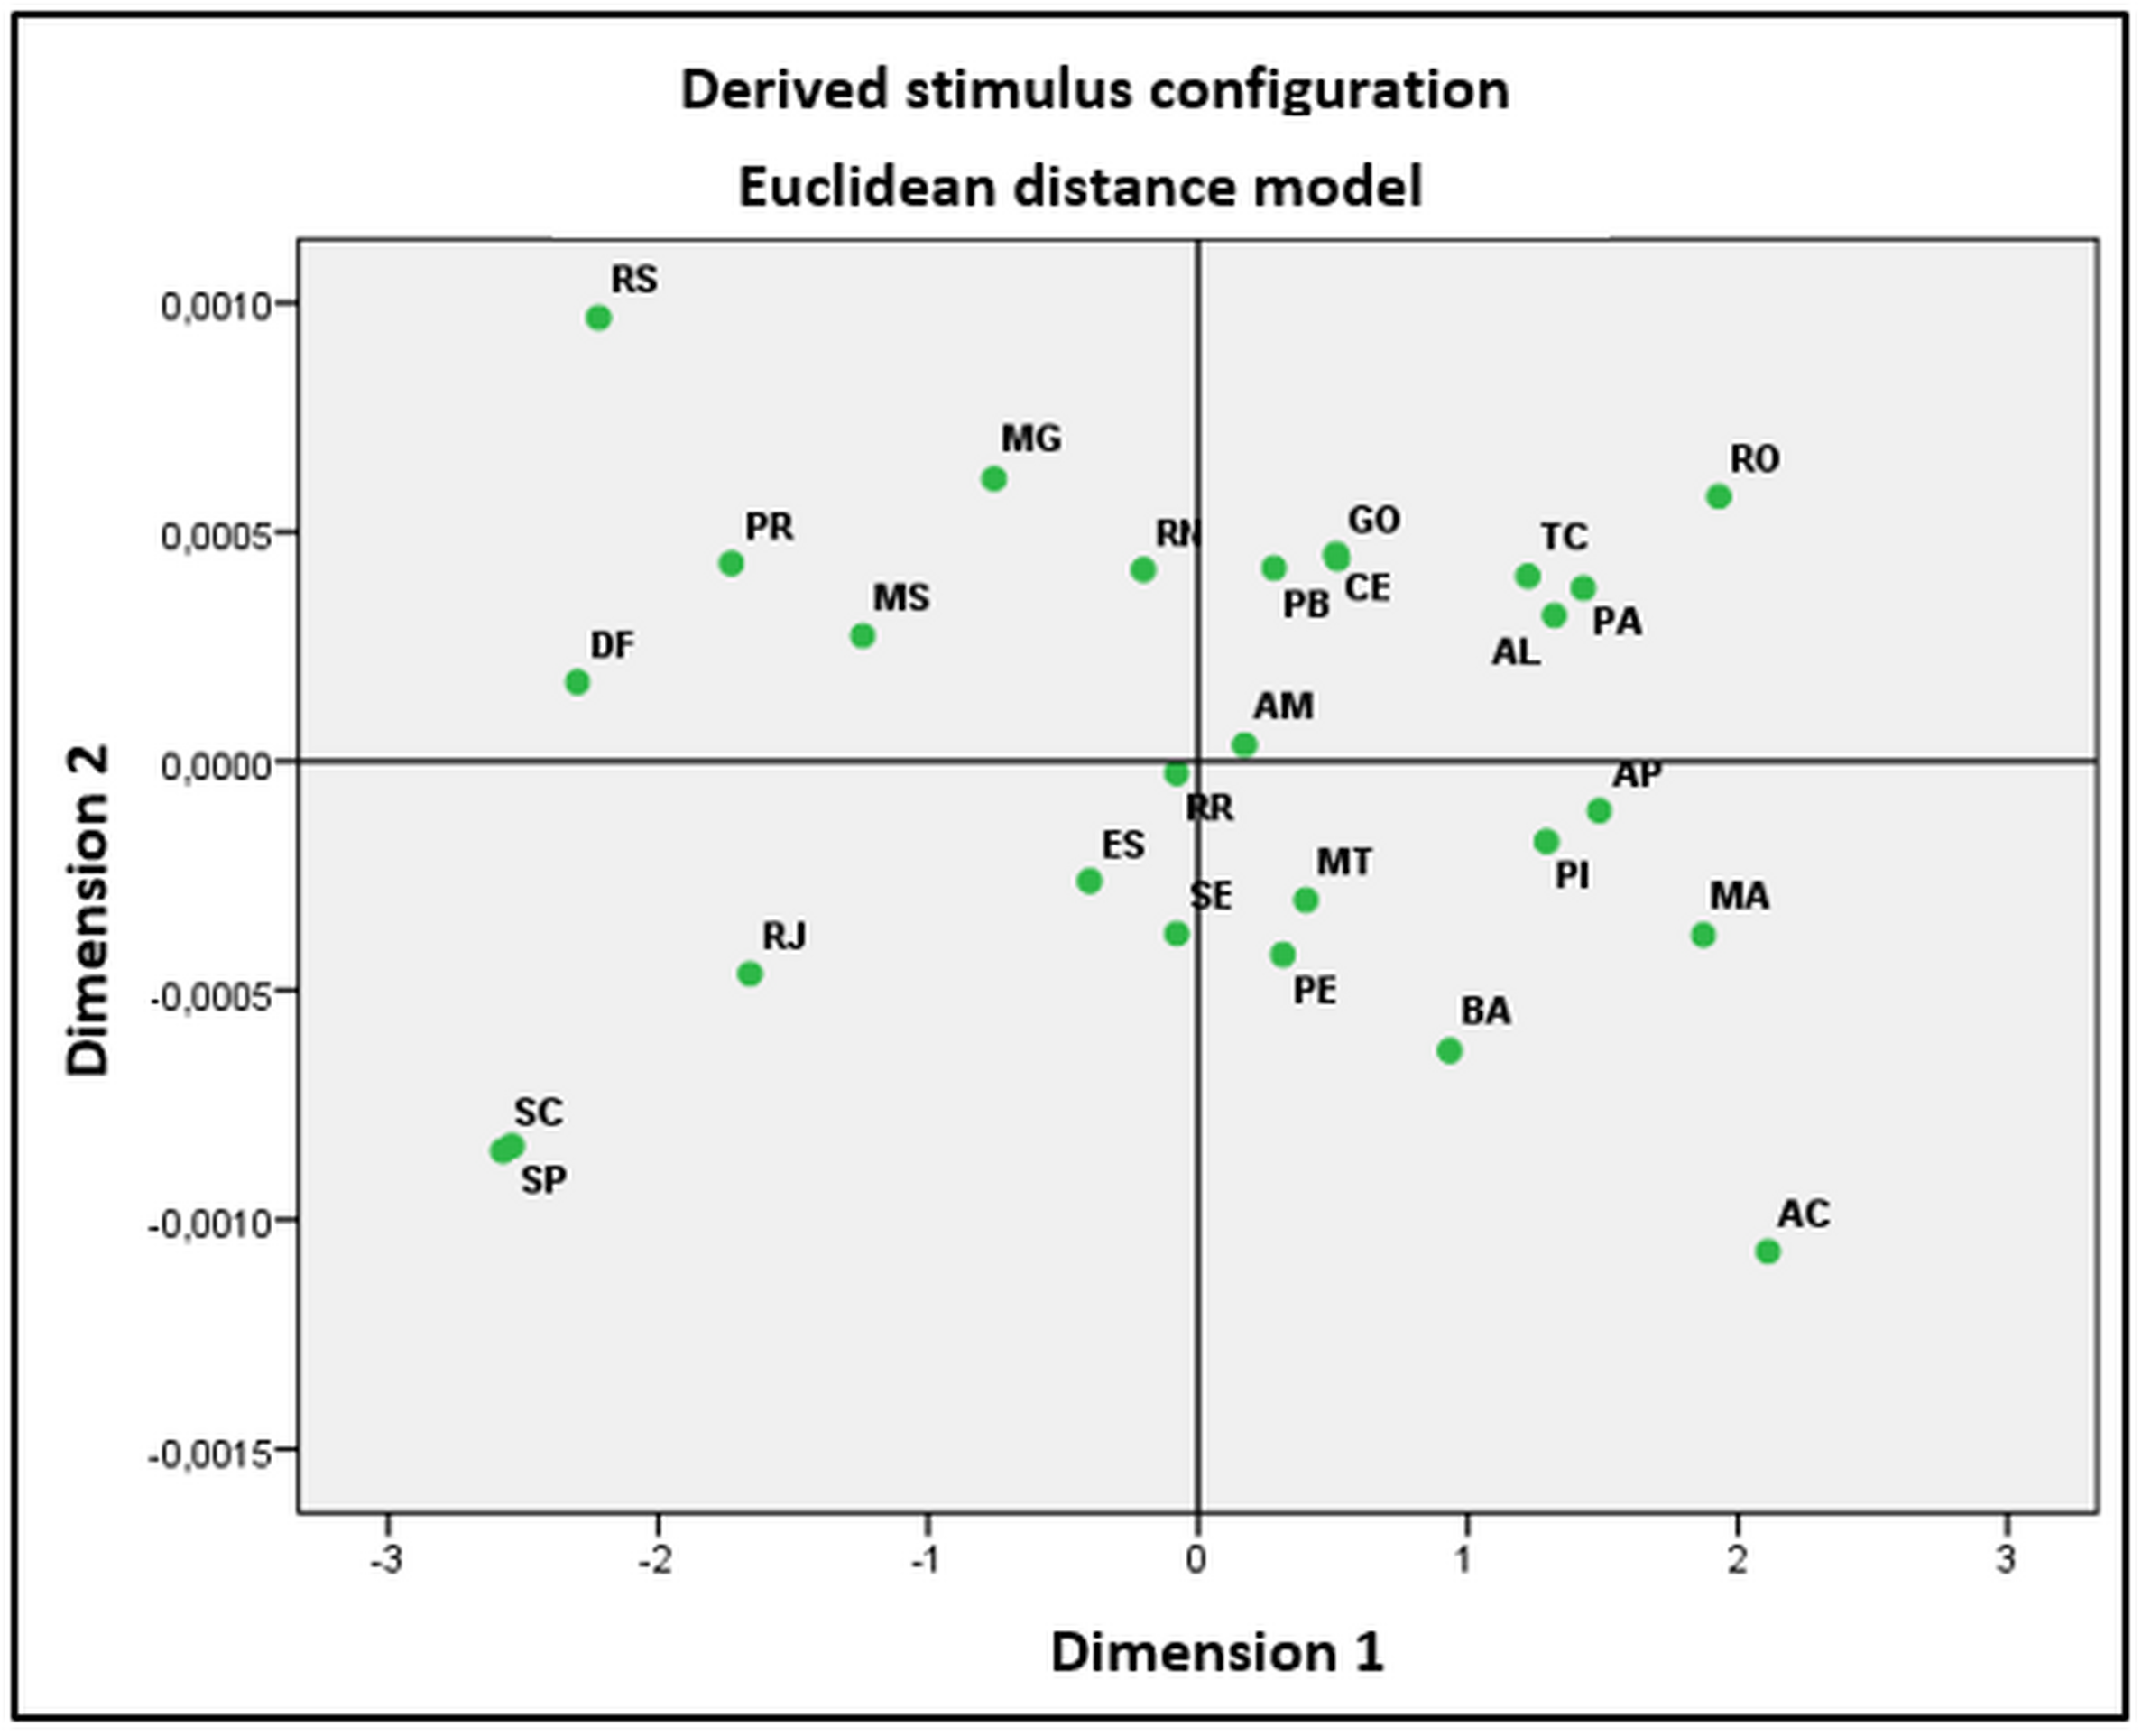
Based on the results obtained through multidimensional scaling, states were spatially ordered at distances represented in multidimensional space according to state performances in innovations, which is illustrated in Figure 01.
Figure 1 - Spatial distribution of Brazilian states
Source: research data
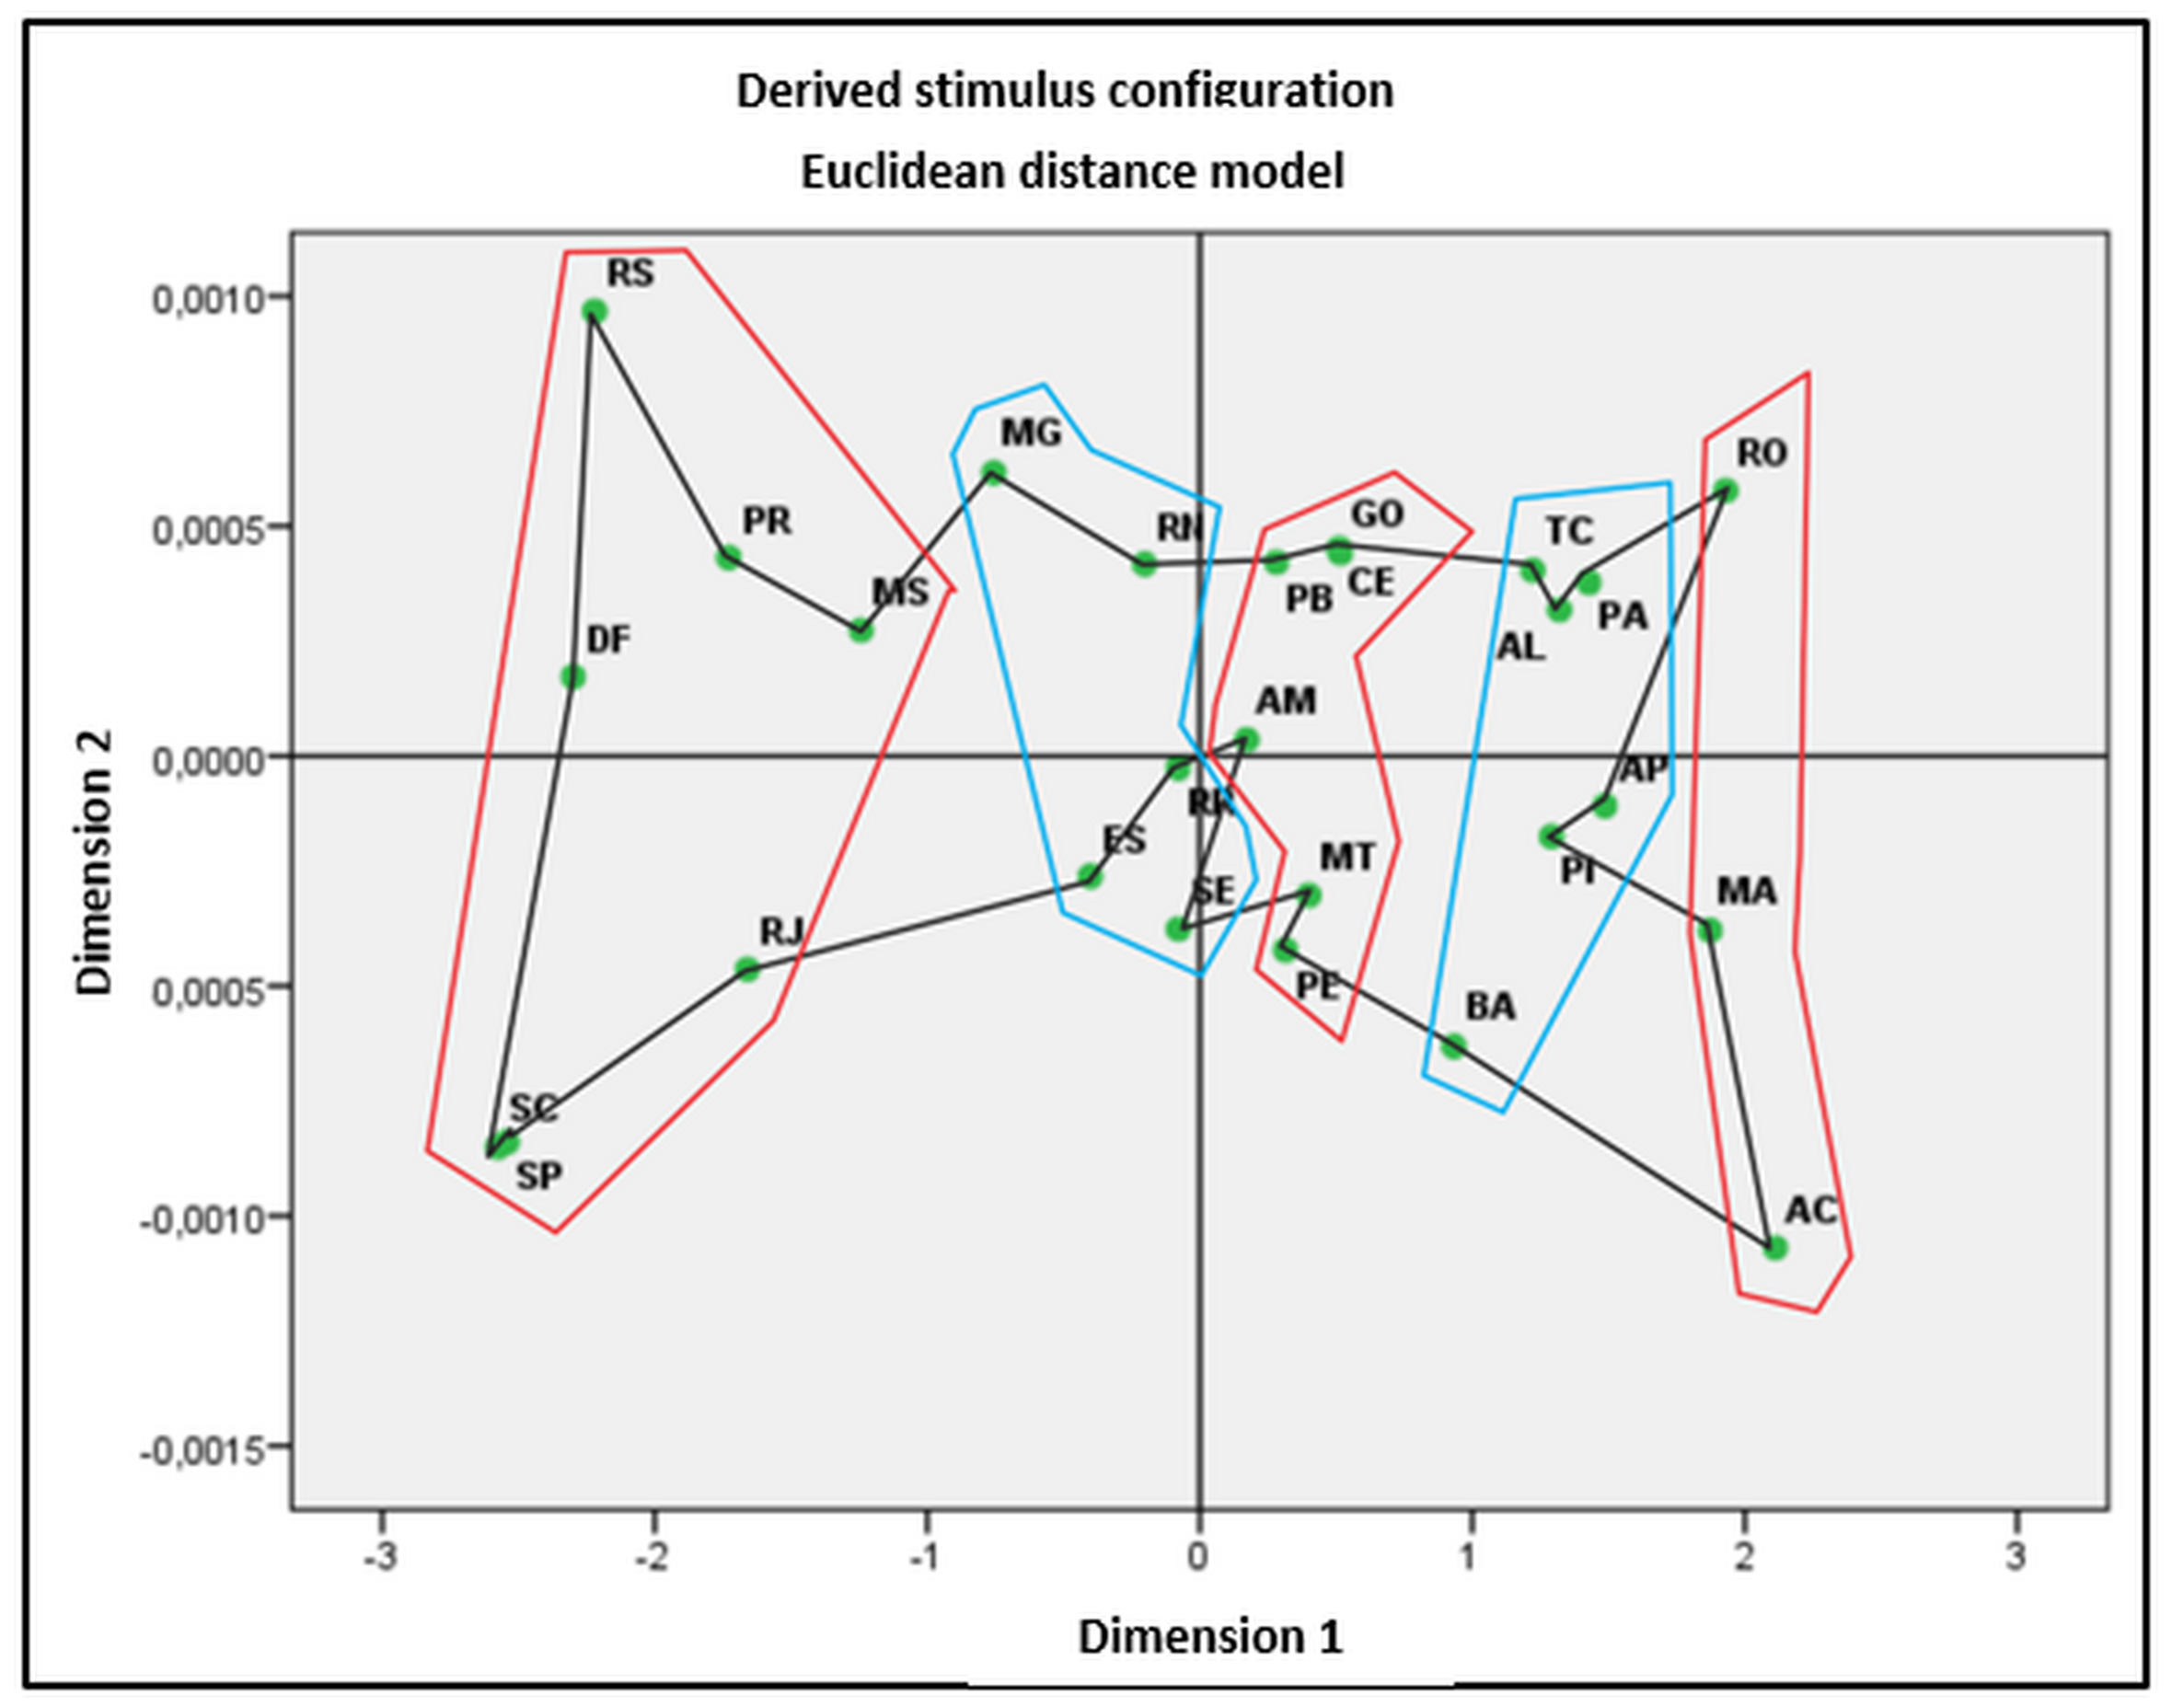
It can be seen through figure 01 that the Brazilian state redistribution spatially grouped the states in a particular way, leading to the proposition of five spatial regions for the analysis of the perceived results (figure 02).
Figure 02 – Cluster analysis of the spatial redistribution of Brazilian states
Source: research data
Formed by the states of Acre (AC), Maranhão (MA) and Rondônia (RO), the first analyzed group presented low performance in all analyzed dimensions. The low scores of these states reflect a series of factors limiting innovative activity: poor infrastructure and business environment, high electricity rates and low organizational and industrial performance. As for investments in research, S&T, as well as education (illiteracy, vulnerability and school attendance, formal quality of the Higher Education Institutions), qualification of the population and workers in the industry, the largest deficit among the levels of education was verified.
The relative HDI of these states shows that such groups do not have an adequate standard of living to enjoy the capabilities and opportunities that are offered to them. In this context, according to the perceived low innovative capacity, the academic, industrial and export performance of these states includes, on average, results below one point, revealing that even with low innovative potential, these states use only 1/3 of their innovative capacity.
The second group is formed by the states of Alagoas (AL), Amapá (AP), Bahia (BA), Pará (PA), Piauí (PI) and Tocantins (TO). With high infrastructure costs and an unfavorable business environment, the states in this group do not perform well concerning innovation. With a positive highlight for the state of Piauí (PI), which has the best index in relation to illiteracy and school vulnerability, the other states in the group present an average score in this index, showing an improvement in relation to the previously analyzed group 01.
These results also highlight an improvement in school attendance and in the formal quality of the Higher Education Institutions. Items such as the qualification of the population and industry professionals show an improvement in the index, but not enough to score significantly higher than the states of Acre (AC), Maranhão (MA) and Rondônia (RO). Therefore, the results presented by the academic, technical, industrial, technological (patents) and financial performance do not include significant results. Unfortunately, these states, without exceptions, present performances in innovations that are less than half of their capacities, showing the underutilization of their innovative potential, represented by the low and inexpressive investment in research, S&T.
The third group composed of the states of Amazonas (AM), Ceará (CE), Goiás (GO), Mato Grosso (MT), Paraíba (PB) and Pernambuco (PE), as well as group 01, present similar performance with rates that fluctuate between poor, regular and average results. Among the dimensions that measure the innovation capacity of the states, it can be noticed that the dimensions that present the greatest amplitude in the results are investments in research, S&T, illiteracy and school vulnerability and qualification of the population. Such amplitude is in line with the other results achieved, which show low infrastructure, signaling considerable electricity costs, with the exception of the state of Amazonas (AM), which has the best energy cost in the country, and a weak and poorly developed business environment, not very favorable to innovations.
As for school attendance, formal quality of the Higher Education Institutions and quality of the professionals, the values found are more balanced and have average performance. The highlight of this group is due to the scores for the relative HDI, which show a representative growth in the human development conditions of these states. In contrast, the results of innovation showed negative similarity, being low in all dimensions of performance. The highlight of this group was the state of Mato Grosso (MT), which, given its limited capacity and low results, presents the best export performance in the country. In summary, the innovation performances of these states correspond to only 2/3 of their capacities, revealing that the possessed capacities are underutilized.
The fourth group analyzed, consisting of the states of Espírito Santo (ES), Minas Gerais (MG), Rio Grande do Norte (RN), Roraima (RO) and Sergipe (SE), represent better and more promising results than the other analyzed groups. Regarding the potential of these states, there is an evolution in the individual performance of its members: among the nine dimensions that contemplate the capacity for innovation, 5 of them (infrastructure, formal quality of the Higher Education Institutions, school illiteracy and vulnerability, school attendance and relative HDI) show results equal to or higher than 3 points on the scale, highlighting a significant increase in the innovative potential of these states.
Despite the low investments in research, S&T, which is the potential deficiency of the group, there is a great amplitude in the scores of the states in relation to the qualification of the population and industry professionals. Such potentialities and deficiencies help in the interpretation of innovative results, which illustrate a better picture: increase in the number of patents and improvement in export performance, with emphasis on the state of Espírito Santo (ES).
It should also be noted that the number of completed guidelines, scientific and technical productions are gaining strength, with the state of Roraima (RO), the national leader in technical productions, as its exponent. In relation to the other already evaluated groups, group 04 presents a better use of its innovative capacities, presenting results that are more balanced. With performance in innovations, between 6 and 8, the group presents average results.
The fifth and last analyzed group is composed of the states that present the best performances in innovations, they are: Distrito Federal (DF), Mato Grosso do Sul (MS), Paraná (PR), Rio de Janeiro (RJ), Santa Catarina (SC) and São Paulo (SP). With an average score close to four points in the dimensions that assess the innovative potential of the states, this group has infrastructure and a business environment favorable to innovation.
With high rates in the formal quality of the Higher Education Institutions and in the school attendance of the population, the group covers the states with the most qualified populations and professionals in the country, which shows good scores in the illiteracy and school vulnerability indexes, in line with the high performances in the country when it comes to relative HDI. With the leadership in six of the fifteen evaluated dimensions, Distrito Federal (DF) is the highlight of the group, followed by the states of São Paulo (SP), leader in two dimensions and by the states of Paraná (PR), Rio de Janeiro (RJ) and Santa Catarina (SC), national exponents in at least one dimension.
With that, it can be noticed that the states of this group, present good capacities and results, with emphasis on the annual number of patents, completed guidelines and scientific production. There is also a balanced export performance among the states that make up the group, a fact that is not repeated in supremacy over industrial performance, except for the state of São Paulo (SP), the national leader, noting that the economy of the others is more related to the provision of services than to the industrial production of consumer goods. Finally, another dimension that deserves to be highlighted, due to its low representativeness is the level of technical production of the states, which presents, on average, with the exception of Santa Catarina (SC) and Mato Grosso do Sul (MS), scores below one point on the scale.
Thus, based on the verified favorable results, it is clear that all states in group 05, present performance in innovation in the country, with results equal to or greater than their innovative capacities, attesting that the administration of resources and state initiatives in favor of education, research, S&T, industry and qualification of professionals has resulted in good innovative performance, with an emphasis on technological innovations.
5 FINAL CONSIDERATIONS
This study sought to verify the distance between Brazilian states, based on state performance in innovations. To do so, a social and macroeconomic analysis of the 26 Brazilian states and Distrito Federal (DF) was carried out based on the innovation performance index, according to the proposed measurement model. This model, the result of a common analysis among the existing indicators at country level, is composed of 15 dimensions, 9 of which comprise the resources and activities that promote entry and 5 that contemplate the results in innovation.
To calculate the performance in innovations of the Brazilian states, the study used secondary data related to infrastructure, business environment, education, qualification of the population and professionals, HDI, patents, technical and scientific production, industrial and export performance. These data were extracted from government databases and related organizations, with open access.
In this sense, aiming to expand the low number of studies that explore innovative performance in the Brazilian regional context, it is believed that by identifying state distances based on innovative performance, it will be possible to provide relevant information for the development and conduction of public policies that can foster the creation of innovative environments capable of contributing to the socioeconomic development of the states.
Based on the proposed methodology, the scores that establish the general innovation performance index were calculated and the interstate distances established. From the estimated distances, the states were redistributed and analyzed according to their provisions. At first, in order to understand the distribution and the spatial distribution of the states, it was noticed that the simple identification of the dimensions with similar performances among the members of the groups does not provide sufficient subsidies for a broad interpretation of the results.
From the 5 established clusters, it was realized that the determining factor for the results obtained were the different stages of state development. That is, due to different socioeconomic realities, states in the same geographic region present different levels of performance. In general, among the dimensions that make up the sub-index of innovation capacity, those that demonstrate values with greater amplitude are investments in S&T, business environment and population qualification. Regarding the dimensions that measure innovation results, the average amplitude is 4.74 on a 5-point scale.
Based on that, when analyzing, additionally, the individual performances of the states in relation to their respective innovation capacities and results in innovation, it is noticed that only 4 states present results in innovations superior to their innovation capacities. That is, of the analyzed 27 federated units, 23 of them underutilize the factors that generate innovations. There are even states that show results below half of their capacity for innovation.
Thus, based on the results obtained, a positive correlation between the level of social development and the performance in innovations is suggested. It is believed that this occurs due to the intrinsic link established between these constructs, because in general, social development is a precondition for economic development. Thus, as the evolution of social development occurs, there is an increase in innovative performance, and consequently in the state's economic performance.
Therefore, from this point of view, as described in the introduction, both the proposed measurement model and its results constitute a methodology capable of representing state performance in innovations, based on the socioeconomic context of each federative unit. Thus, through the identification of interstate distances based on innovative performance, in terms of academic contributions, this work aimed to illustrate the factors that make up state innovation environments. And, managerially, to offer to those responsible for the management of public and private organizations, information that can guide the elaboration and conduction of public policies to foster innovation, consistent with the socio-political-economic particularities of each state.
As for the aspects that limited the scope of the empirical results of this paper, the following stand out: there is a small number of studies exploring this research theme, partial access to government data related to the dimensions of the proposed model and a small sample size (n=27). Therefore, it is suggested that in the elaboration of future works, the proposed model should be refined, allowing to reflect more reliably on the respective socio-political-economic realities of each state. Additionally, it is suggested the use of moderating variables for the relationships established between individuals, companies and the State.
REFERÊNCIAS
AIKEN, Michael; HAGE, Jerald. The organic organization and innovation. Sociology, v. 5, n. 1, p. 63-82, 1971.
ALEXE, Cătălin-George; ALEXE, Cătălina-Monica. The Importance of the Dimensions of the Innovation Management in Evaluating the Innovation Capability of the Firms in the Machine Building Industry in Romania. Procedia Technology, v. 22, p. 999-1005, 2016.
BARTEL, Caroline A.; GARUD, Raghu. The role of narratives in sustaining organizational innovation. Organization Science, v. 20, n. 1, p. 107-117, 2009.
BASKARAN, Shruthi; MEHTA, Khanjan. What is innovation anyway? Youth perspectives from resource-constrained environments. Technovation, 2016.
CARLSSON, Bo et al. Innovation systems: analytical and methodological issues. Research policy, v. 31, n. 2, p. 233-245, 2002.
CERVO, Amado Luiz; BERVIAN, Pedro Alcino. Metodologia científica.5. ed. São Paulo: Prentice Hall, 2002.
COHEN, Wesley M.; LEVINTHAL, Daniel A. Absorptive capacity: A new perspective on learning and innovation. Administrative science quarterly, p. 128-152, 1990.
DAMANPOUR, Fariborz. Organizational innovation: A meta-analysis of effects of determinants and moderators. Academy of management journal, v. 34, n. 3, p. 555-590, 1991.
DAMANPOUR, Fariborz; WISCHNEVSKY, J. Daniel. Research on innovation in organizations: Distinguishing innovation-generating from innovation-adopting organizations. Journal of engineering and technology management, v. 23, n. 4, p. 269-291, 2006.
DAWE, Susan. Vocational Education and Training and Innovation. Research Readings. National Centre for Vocational Education Research Ltd., Australia, 2004.
DERELI, Deniz Dilara. Innovation Management in Global Competition and Competitive Advantage. Procedia-Social and Behavioral Sciences, v. 195, p. 1365-1370, 2015.
EDQUIST, Charles. The Systems of Innovation Approach and Innovation Policy: An account of the state of the art. In: DRUID Conference, Aalborg. 2001. p. 12-15.
FERREIRA, Paulo Jorge Silveira; DIONÍSIO, Andreia Teixeira Marques. What are the conditions for good innovation results? A fuzzy-set approach for European Union. Journal of Business Research, 2016.
FURMAN, Jeffrey L.; PORTER, Michael E.; STERN, Scott. The determinants of national innovative capacity. Research policy, v. 31, n. 6, p. 899-933, 2002.
GOPALAKRISHNAN, Shanti; DAMANPOUR, Fariborz. A review of innovation research in economics, sociology and technology management. Omega, v. 25, n. 1, p. 15-28, 1997.
GRUPP, Hariolf et al. Foundations of the Economics of Innovation. Books, 1998.
GRUPP, Hariolf; MOGEE, Mary Ellen. Indicators for national science and technology policy: how robust are composite indicators?. Research Policy, v. 33, n. 9, p. 1373-1384, 2004.
GRUPP, Hariolf; SCHUBERT, Torben. Review and new evidence on composite innovation indicators for evaluating national performance.Research Policy, v. 39, n. 1, p. 67-78, 2010.
HAIR, Joseph F. et al. Análise multivariada de dados. Bookman Editora, 2009.
HOLLEN, Rick; VAN DEN BOSCH, Frans AJ; VOLBERDA, Henk W. The role of management innovation in enabling technological process innovation: An inter‐organizational perspective. European Management Review, v. 10, n. 1, p. 35-50, 2013.
HU, Albert Guangzhou. R&D organization, monitoring intensity, and innovation performance in Chinese industry. Economics of Innovation and New Technology, v. 12, n. 2, p. 117-144, 2003.
KAMASAK, Rifat. Determinants of innovation performance: a resource-based study. Procedia-Social and Behavioral Sciences, v. 195, p. 1330-1337, 2015.
KATZ, J. Sylvan. Indicators for complex innovation systems. Research policy, v. 35, n. 7, p. 893-909, 2006.
KOC, Tufan. Organizational determinants of innovation capacity in software companies. Computers & industrial engineering, v. 53, n. 3, p. 373-385, 2007.
KOC, Tufan; CEYLAN, Cemil. Factors impacting the innovative capacity in large-scale companies. Technovation, v. 27, n. 3, p. 105-114, 2007.
LALL, Sanjaya. Competitiveness indices and developing countries: an economic evaluation of the global competitiveness report. World development, v. 29, n. 9, p. 1501-1525, 2001.
LAZONICK, William. Indigenous innovation and economic development: Lessons from China's leap into the information age. Industry and Innovation, v. 11, n. 4, p. 273-297, 2004.
LAZONICK, William. Innovative enterprise and historical transformation. Enterprise and Society, v. 3, n. 01, p. 3-47, 2002.
LUNDVALL, Bengt‐Åke. National innovation systems—analytical concept and development tool. Industry and innovation, v. 14, n. 1, p. 95-119, 2007.
MAHROUM, Sami; AL-SALEH, Yasser. Towards a functional framework for measuring national innovation efficacy. Technovation, v. 33, n. 10, p. 320-332, 2013.
NARANJO-VALENCIA, Julia C.; JIMÉNEZ-JIMÉNEZ, Daniel; SANZ-VALLE, Raquel. Studying the links between organizational culture, innovation, and performance in Spanish companies. Revista Latinoamericana de Psicología, v. 48, n. 1, p. 30-41, 2016.
OCDE. Manual de Oslo: diretrizes para a coleta e interpretação de dados sobre inovação tecnológica. Publicado pela FINEP (Financiadora de Estudos e Projetos), 3. ed., 2006.
PAVITT, Keith. Sectoral patterns of technical change: towards a taxonomy and a theory. Research policy, v. 13, n. 6, p. 343-373, 1984.
PRAJOGO, Daniel I.; AHMED, Pervaiz K. Relationships between innovation stimulus, innovation capacity, and innovation performance. R&D Management, v. 36, n. 5, p. 499-515, 2006.
REJEB, Helmi Ben et al. Measuring innovation best practices: Improvement of an innovation index integrating threshold and synergy effects.Technovation, v. 28, n. 12, p. 838-854, 2008.
RICHARDSON, R. J. et al. Pesquisa social: métodos e técnicas. 3.ed. São Paulo: Atlas, 1999.
SANTOS, David Ferreira Lopes et al. Innovation efforts and performances of Brazilian firms. Journal of Business Research, v. 67, n. 4, p. 527-535, 2014.
SCHUMPETER, Joseph Alois. The theory of economic development: An inquiry into profits, capital, credit, interest, and the business cycle. Transaction publishers, 1934.
SILVA, Marise Borba de; GRIGOLO, Tânia Maris. Metodologia para iniciação científica à prática da pesquisa e da extensão II. Caderno Pedagógico. Florianópolis: Udesc, 2002.
SZETO, Elson. Innovation capacity: working towards a mechanism for improving innovation within an inter-organizational network. The TQM Magazine, v. 12, n. 2, p. 149-158, 2000.
TEKIN, Husnu; TEKDOGAN, Omer Faruk. Socio-Cultural Dimension of Innovation. Procedia-Social and Behavioral Sciences, v. 195, p. 1417-1424, 2015.
TÖDTLING, Franz; TRIPPL, Michaela. One size fits all?: Towards a differentiated regional innovation policy approach. Research policy, v. 34, n. 8, p. 1203-1219, 2005.
VILLA, Luis Suarez. Invention, inventive learning, and innovative capacity. Behavioral Science, v. 35, n. 4, p. 290-310, 1990.
WALKER, Richard M.; CHEN, Jiyao; ARAVIND, Deepa. Management innovation and firm performance: An integration of research findings.European Management Journal, v. 33, n. 5, p. 407-422, 2015.
[1] Mestre em Administração. Redatora Técnica e Pesquisadora. Universidade Regional de Blumenau – FURB, Santa Catarina, Brasil. E-mail: elainevaz1993@gmail.com
[2] Doutora em Métodos Numéricos em Engenharia. Professora do Departamento de Matemática - Universidade Regional de Blumenau – FURB, Santa Catarina, Brasil. E-mail: akroenke@furb.br
[3] Mestre em Administração. Universidade Regional de Blumenau- FURB, Santa Catarina, Brasil. E-mail: danielaferrari1987@hotmail.com
[4] Mestre em Administração, Especialista em Psicologia Organizacional, Docente do curso superior em Administração. Universidade Regional de Blumenau – FURB e Uniasselvi - Sociedade Educacional Leonardo da Vinci, Santa Catarina, Brasil. E-mail: bianca.grubert@gmail.com