 Received: 31/07/2023
Accepted: 21/05/2025
Socio-economic development indicators of the municipalities of Maracaju and Ponta Porã, Mato Grosso do Sul
Indicadores de desenvolvimento socioeconômico dos municípios de Maracaju e Ponta Porã, Mato Grosso do Sul
Simone Pereira da Silva Baio1i, ORCID: https://orcid.org/0000-0002-4292-8101; Ademir Kleber Morbeck de Oliveira2ii, ORCID: https://orcid.org/0000-0001-9373-9573; Rosemary Matias3iii, ORCID: https://orcid.org/0000-0002-0154-1015
1. Universidade Federal de Mato Grosso do Sul (UFMS) - Chapadão do Sul/MS, Brasil. E-mail: simone.pereira@ufms.br
2. Universidade Anhanguera – Uniderp – Campo Grande – MS, Brasil. E-mail: akmorbeckoliveira@gmail.com
3. Universidade Anhanguera – Uniderp – Campo Grande – MS, Brasil. E-mail: rosematiasc@gmail.com
Abstract
Ponta Porã and Maracaju are important agribusiness centers and contribute to the socioeconomic development of the State. The research has a documentary approach, evaluating different indicators, such as the Gross Domestic Product per capita, the Municipal Human Development Index, and the FIRJAN Municipal Development Index, in addition to the disparity indicator and the Economic Growth Level Index. The objective was to analyze the socioeconomic development indicators considering the economic prominence of these municipalities from 2005 to 2019. The disparity in the GDP per capita indicated differences between the cities, with a significant reduction in the disparity from 2012 onwards, with Ponta Porã obtaining an improvement in the indicators. There is a correlation between the GDP of the cities and the growth of the economy of Mato Grosso do Sul, contributing to an increase in employment, wealth generation, and income considering that several companies that operate in the region are directly or indirectly linked to agribusiness.
Palavras-chave: IFDM Employment and Income, HDI-E, level of economic growth.
Resumo
Ponta Porã e Maracaju são importantes polos do agronegócio e contribuem para o desenvolvimento socioeconômico do estado. A pesquisa possui enfoque documental e foram avaliados diferentes indicadores, como: Produto Interno Bruto per capita, Índice de Desenvolvimento Humano Municipal, Índice FIRJAN de Desenvolvimento Municipal, além do indicador de disparidade e o Índice de Nível de Crescimento Econômico. Objetivou-se analisar os indicadores de desenvolvimento socioeconômico dos municípios, utilizando como marco temporal os anos de 2005 a 2019. A disparidade do PIB per capita indicou diferenças entre os municípios, com sua redução significativa a partir do ano de 2012, com Ponta Porã obtendo melhoria dos indicadores. Existe correlação do PIB dos municípios com o crescimento da economia sul mato-grossense, colaborando para aumento de emprego, geração de riqueza e renda, já que diversas empresas que atuam na região estão ligadas de forma direta ou indireta com o agronegócio.
Keywords: IFDM Emprego & Renda, IDH-M, nível de crescimento econômico.
Citation: Baio, S. P. S., Oliveira, A. K. M. & Matias, R. (2025). Socio-economic development indicators of the municipalities of Maracaju and Ponta Porã, Mato Grosso do Sul. Gestão & Regionalidade, v. 41, e20259218. https://doi.org/10.13037/gr.vol41.e20259218
1 Introduction
Socioeconomic development allows people to undergo social and economic transformations throughout their lives, thus achieving improved quality of life, decent work opportunities, and better educational and health levels, among other actions (Belarmino & Vieira, 2020). It is important to remember that socioeconomic development includes elements that go beyond increased production and improved income distribution. It is also necessary to guarantee access to quality public services, allowing for continuous improvements in social well-being. However, for this to happen, state intervention is essential for this purpose through public policies, since the market does not offer this type of service (Raiher & Lima, 2014; Lima, 2019).
Thus, public management efficiency consists of optimizing the use of resources, obtaining the maximum possible supply of public goods and services, in quantitative and qualitative terms (Hauner & Kyobe, 2010; Mukokoma & Dijk, 2013). If this does not occur, socioeconomic inequalities become a problem. According to Santana and Barreto (2017) and Passos and Passos (2024), Brazil has elevated levels of regional inequalities, compared to developed nations, which raises the hypothesis of intense institutional heterogeneity among municipalities (different institutional environments).
Reducing these disparities has been the subject of intense debate, both in academia and in political bodies, presenting itself as one of the great challenges to be faced to improve the level of development of the nation-state (Lima, 2019). The identification of these aspects has become an indispensable condition for the adoption of effective public policies for regional development, but with regard to their internal dynamics, it is still necessary to understand the peculiarities inherent to each geographic space (Begnini & Almeida, 2016; Lima, 2019; Corrêa & Duarte, 2022).
Thus, socioeconomic indicators are an important instrument and should be used by the government to assist public policies in the process of solving social problems or modernizing services, since through their analysis it is possible to identify the most urgent issues (Santana & Barreto, 2017). In this sense, an indicator produces information allowing the public agent to monitor a certain task, program or activity, enabling its maintenance or correction (Siedenberg, 2003; Santana & Barreto, 2017).
Among the development assessment mechanisms is the Gross Domestic Product (GDP), one of the main indicators used to measure the economic growth of a city, state or country, for example. However, alone it is not capable of providing regionalized information covering issues, such as income distribution and people's quality of life (Fernandes, Tavares & Azevedo, 2018). But it is an important instrument, as demonstrated by Postali and Nishijima (2011), who used the GDP per capita of municipalities to explain the IFDM (FIRJAN Municipal Development Index), given the unavailability of income per capita for all municipalities on an annual basis and that the GDP does not always reflect the level of inequality of family income. Therefore, it is important to use different indexes, such as the Human Development
Index (HDI), a fundamental concept to understand and measure the population's socioeconomic advances, as it allows us to understand that improvements in the population's quality of life go beyond economic improvements, also encompassing social, cultural and political improvements (Mendes, Bomeny & Costa, 2018). The use of the Municipal Human Development Index (HDI-M), in the dimensions of Longevity, Education and Income, allows us to demonstrate socioeconomic transformations and analyze the human development in municipalities, states and in Brazil (Rocha & Carvalho, 2015).
Within this context, the IFDM was created in 2008 by the Federation of Industries of the State of Rio de Janeiro (FIRJAN), inspired by the HDI, to assess the development of municipalities in three areas (Employment & Income, Education and Health), where its calculation is made based on the arithmetic mean of its components and official data that the municipalities declare, in addition to information from the Ministries of Labor, Education and Health (FIRJAN, 2018a).
The state of Mato Grosso do Sul is a region with accelerated economic growth, a process related to agribusiness according to the Brazilian Institute of Geography and Statistics (IBGE, 2021a). However, growth is not the same in all municipalities, and Maracatu and Ponta Porã stand out as those with a greater agricultural vocation (the main source of wealth in the regional context (IBGE, 2021a). It was expected that the observed wealth would also result in improved living conditions for the population, a situation related to the efficient use of public resources, which does not always happen. This discussion has gained importance with regard to good fiscal management practices and their relationship with economic development and the reduction of social inequalities (Diniz, Macedo & Corrar, 2012), a situation to be studied mainly in places with a large generation of resources, such as agricultural hubs. The wealth of these two municipalities can be observed through the revenues of the total ICMS (trade, industry, cattle raising, agriculture, services and extraordinary gains). Maracaju, in 2019, had a revenue of R$ 61,503,386.59, of which R$ 33,210,406.60 (54%) was related to agriculture, an indication of the importance of its main activity. In Ponta Porã, the revenue in 2019 was R$ 120,311,908.28, of which R$ 37,447,079.09 (31,1%) was related to agriculture, which is second in relation to the revenue, the prominent one being trade (SEMAGRO, 2021).
Municipal socioeconomic development is related to social and quality of life factors, such as public education and health services (Diniz, Macedo & Corrar, 2012), and it is important to evaluate the development of different regions, especially those linked to agribusiness, an activity that generates many resources. In this sense, theoretical and empirical studies are carried out and contribute to public policymakers in the decision-making, in relation to the areas that need greater financial support to promote their human development (Mattei, Bezerra & Mello, 2018), using, for example, the HDI-M.
Considering the theme of municipal development, the objective was to analyze indicators of socioeconomic development of the municipalities of Maracaju and Ponta Porã, located in Mato Grosso do Sul. To this end, indicators of socioeconomic development were used, such as the GDP per capita, the HDI-M and the IFDM, in addition to the INC and the Disparity Indicator. The article is structured in sections, such as introduction, problematization, concepts and objectives regarding the indicators of socioeconomic development of the municipalities, and the subdivisions contain the theoretical content, material and methods, results and discussion, and the final considerations.
2. Material and Methods
2.1 Study area
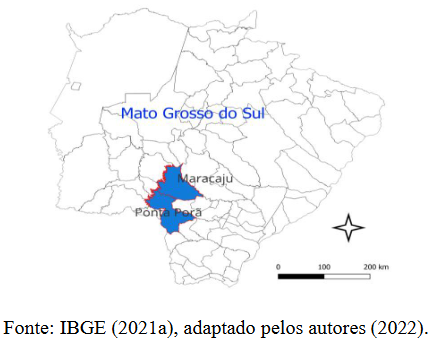
The state of Mato Grosso do Sul is part of the Central-West region (Figure 1) and has an HDI equal to 0.729, classified as a high standard of development. Among the municipalities evaluated, Maracaju has an area of 5,396.905 km² and a population of 48,944 inhabitants, with a general HDI-M equal to 0.736, an Income HDI-M of 0.744, a Longevity HDI-M of 0.873 and an Education HDI-M of 0.613. Ponta Porã has an area of 5,359.354 km² and a population of 95,320 people, with a general HDI-M equal to 0.701, an Income HDI-M of 0.708, a Longevity HDI-M of 0.812 and an Education HDI-M of 0.598 (ATLAS Brasil, 2021; IBGE, 2021a).
Figure 1 - Location of the municipalities of Maracaju and Ponta Porã, Mato Grosso do Sul
Source: IBGE (2021a), adapted by the authors (2022).
Maracaju is in the region that comprises the Serra de Maracaju, which holds the largest soybean production in the state, an area that in recent years has developed due to agriculture (soybean, corn and sugar cane), being the 11th largest soybean producer in Brazil and the third largest economy in the state (Prefeitura Municipal de Maracaju, 2024). Ponta Porã is also located in the Serra de Maracaju and currently presents a major change in the agricultural sector, with the old brachiaria pastures and extensive cattle raising being replaced by soybean, corn and sugar cane crops, in a new dynamism in the municipality, transforming the area into a large grain producer (Prefeitura Municipal de Ponta Porã, 2024).
2.2 Data collection
The research is characterized as a documentary/bibliography, related to the collection of information from reference databases in the area (Gil, 2017). The work analyzed the socioeconomic development of Maracaju and Ponta Porã, considering the period between 2005 and 2019, with the collection procedures being a documentary, bibliographic research and data collection (secondary). The data on the HDI-M (1991, 2000 and 2010) and GDP per capita (2005 to 2019) were collected from the website of the Brazilian Institute of Geography and Statistics (IBGE, 2021b). The other information (IFDM) was obtained from the Federation of Industries of the State of Rio de Janeiro (2005 to 2016) (FIRJAN, 2018b).
The use of the IFDM was based on the analysis of the four dimensions (General, Education, Health, Employment & Income) that make up the index, giving a score to each municipality and demonstrating the degree of classification of its development. In this way, the indicator can be a tool to assist public managers in making comparisons between municipalities and the state itself, providing information for better decision-making and investment, assisting in its socioeconomic development (Pereira & Ávila, 2023). For this research, the IFDM indicators for the period of 2005 and 2018 were analyzed - Base year of 2016, which was the last updated version of the data available for consultation.
2.3 Indexes used
(1) HDI-M. The Municipal Human Development Index has three pillars: long and healthy life (Longevity - life expectancy at birth), access to knowledge (Education - schooling of the adult population and school flow of the young population) and quality of life (Income - standard of living and income per capita). It is divided into five categories: exceptionally low human development (≤ 0.499); low human development (0.500 - 0.599); medium human development (0.600 - 0.699); high human development (0.700 - 0.799); and very high human development (≥ 0.800) (PNUD/IPEA/FJP, 2013).
(2) IFDM. The FIRJAN (Federation of Industries of the State of Rio de Janeiro) Municipal Development Index. It is a composite indicator that addresses, with equal weighting, three areas of human development: Employment & Income, Education and Health, seeking to consolidate in a single number the level of local socioeconomic development, through the simple average of the results obtained in each of the areas (FIRJAN, 2018a). The Health IFDM assesses the quality of basic health services. The Education IFDM, childhood education (quantitative focus) and fundamental education (qualitative focus). The Employment & Income IFDM, the generation, absorption and distribution of employment and income (Barbosa, 2017). The index ranges from 0 to 1 and the closer it is to 1, the greater the development, with four categories used: low (0 - 0.399), regular (0.400 - 0.599), moderate (0.600 - 0.799) and high (0.800 - 1) (FIRJAN, 2018a).
(3) INC. The Economic Growth Level Indicator. According to Piacenti et al. (2012) and Lima, Piffer and Ostapechen (2016), it determines the level of economic growth of municipalities, in relation to the state average. INC = [GDPpci / GDPpcm × 100] (%), where: GDPpci = Municipal Gross Domestic Product per capita (i = 1, 2, 3, ...); and, GDPpcm = State Average Gross Domestic Product per capita, which classifies municipalities as having significant, high, medium or low potential levels of economic development (Table 1).
Table 1 - Classification of the Growth Level Indicator (INC) Economic Development Potential INC range (%)
Significant Greater than 100
High 80 to 99
Medium 50 to 79
Low 20 to 49
Source: Piacenti et al. (2012).
(4) Regional Disparity Indicator (ID). It measures the convergence of the socioeconomic development of municipalities in relation to the most developed municipality in the mesoregion and the Brazilian average, a convergence characterized as the tendency to approximate the profile of municipalities or other units, such as regions. For convergence to occur, less developed municipalities need to have growth or improvement in their indicators at higher rates than the municipality with the best performance (Trevisan & Lima, 2010).
According to Mantovani et al. (2020), the ID can be estimated for both growth and socioeconomic development through the variables of GDP per capita and the general IFDM, whereby: [ID = (Xi -Xmin j) / (Xw j - Xmin)]; X = general IFDM of the municipality; j = mesoregion; Xmin = B smallest observed variable (general IFDM of the state); and, Xw = largest observed variable (general IFDM in relation to Brazil), ranging from 0 to 1. The higher the result, the better the convergence of the municipality evaluated against the most dynamic municipality, with superior performance when compared to the others, at the same pace as the one with the greatest dynamism. The General IFDM was used in the estimate and the ID verifies the convergence regarding the socioeconomic development, with the classification parameters being: values >0.30 = considered as convergent against the most dynamic; values between 0.19 and 0.29 = tending towards convergence; and values <0.18 = diverge from the most dynamic to the most stagnant.
2.3 Data analysis
Regarding the location of the municipalities, the map was created using the QGIS 3.26 program, including the location of Maracaju and Ponta Porã, in Mato Grosso do Sul. The data obtained were tabulated using statistical calculations (indicators) and graphical representations, presented in spreadsheets derived from Microsoft Office Excel 360.
3 Results and discussion
Oliveira (2024) reports that in the 2022/2023 harvest, Maracaju produced more than 3.2 million tons (MT) of soybeans and corn, while Ponta Porã, 2.4 MT, surpassing the main producing municipalities, such as Sidrolândia (2.3 MT), Dourados (1.9 MT), Rio Brilhante (1.3 MT) and São Gabriel do Oeste (1.2 MT), giving prominence to the agricultural production of these municipalities for the state's agribusiness. This highlights the economic indicators for the region.
HDI-M
The results of the HDI-M in its three dimensions, according to the demographic census (IBGE, 2021a), indicated that in 1991 the two municipalities had an exceptionally low HDI. In 2000, they were in a transition zone from low to medium HDI and in 2010, they reached a high HDI, with better growth for Maracaju, above the state HDI (0.729). At the end of the period evaluated, both municipalities were at the state average, with a high HDI (0.700 - 0.799) (Figure 2), demonstrating the importance of agriculture for both.
Figure 2 - Municipal Human Development Index (MHDI) in Ponta Porã and Maracaju, Mato Grosso do Sul.
Source: ATLAS Brasil (2021). Life Expectancy at Birth: LEB; Municipal Human Development Index: MHDI.
The Human Development Report (ONU, 2013) shows that development is a process of change in society to improve the well-being of the population over time, expanding its range of choices in the areas of health, education and income. Therefore, it is defined as the process in which economic growth (employment and income) and social growth (education and health) are interconnected in a relationship of dependence, since development is more intricately linked to the issue of having greater or lesser insertion in the globalized economy. Sen, Motta and Marques (2000) describe socioeconomic development as a process of social and economic changes and not only industrialization and growth in employment and income, but also health and educational services.
In this way, the HDI-M can determine the existence and extent of inequalities in the population and facilitate public policies to solve such problems. In large areas, the probability of creating a situation of apartheid is high and, therefore, the application of the HDI-M should be on a smaller scale in order to identify the situation more clearly, becoming a fundamental indicator to outline urban social issues (Torres & Dias, 2016). Caldarelli, Camara and Perdigão (2015) confirm the importance, writing that the quality of life is affected by social, educational, political and cultural dimensions, in addition to economic dimensions.
When evaluating the pillars separately, the Education HDI-M was exceptionally low between 1990 and 2000, reaching the average in 2010. Last year, the values for Maracaju were higher than those found in Ponta Porã, representing an improvement in the municipal education. Education must be a priority for public policy makers, because in the theory of human capital, investments in education can add skills to individuals, making them more productive, which can influence the national development positively (Schwartzman, 2006). The author adds that, in this way, deprivation of education is one of the most inequitable forms of social deprivation, since educational inequalities are one of the main factors in terms of discrepancies in income, opportunities and living conditions, which generate poverty.
Regarding the Longevity HDI-M, in 1991 and 2000 there was high human development and in 2010, remarkably high human development, highlighting Maracaju once again with the best index. Thus, life expectancy at birth in Maracaju would be more adequate, with better social, health and salubrity conditions of the population when considering mortality rates in its different age groups, in addition to all causes of death that are considered (PNUD/IPEA/FJP, 2013).
The Income HDI-M indicates that between 1990 and 2000 there was average human development, reaching high human development in 2010, highlighting Maracaju once again with the best index. The income pillar represents the degree of freedom of citizens in their individual choices and of them having access to basic human needs, such as water, housing and food. Its presence, at an adequate level, enables individual choices, while its lack, means a state of deprivation of freedom of choice, and may not “...ensure a decent standard of living...” (Pinto, Costa & Marques, 2013).
The FIRJAN Municipal Development Index
The IFDM allows us to monitor the evolution or decline of municipalities, verifying whether they are competently overcoming Brazil's socioeconomic challenges, in addition to verifying whether the improvement in the ranking has occurred as a consequence of the decline of other municipalities or through the evolution of local administration, resulting from the efficient implementation of public policies (FIRJAN, 2018b). In relation to Maracaju (Figure 3A), the General IFDM indexes, compared to Ponta Porã (Figure 3B), did not demonstrate a significant difference. However, it is clear that the levels of development classified by the IFDM are moderate for both municipalities, highlighting that in 2005, Ponta Porã had below-average development (regular development).
Figure 3 - FIRJAN Municipal Development Index – General FMDI, Employment & Income, Health, Education for Maracaju (A) and Ponta Porã (B), Mato Grosso do Sul, from 2006 to 2016.
Source: FIRJAN (2018b).
When analyzing the different dimensions of the IFDM, Maracaju presented an increase in the General IFDM of 0.74%, in the Education IFDM, a growth of 23.1%, in the Health IFDM, an increase of 1.5% and, in the Employment & Income IFDM, a reduction of 18.5%, with all dimensions classified as having moderate development. Ponta Porã presented an increase in the General IFDM of 16.7%, in the Education IFDM, a growth of 41.6%, in the Health IFDM, an increase of 30.1% and, in the Employment & Income IFDM, a reduction of 20.7%, all dimensions having a moderate development.
In Ponta Porã, the General, Education and Health dimensions showed an improvement in socioeconomic development, going from regular development to moderate development. The Employment & Income dimension showed a decrease for both municipalities, despite remaining in the regular development classification, with a decrease of 20.7% in Ponta Porã and 18.5% in Maracaju. Anastácio, Vieira and Amaral (2021) in their research on the microregion of São João Del-Rei - MG, highlighted that the Employment & Income dimension also showed a decrease in 2008 due to the global economic crisis, which strongly impacted the economy of different municipalities, which may have happened in the municipalities evaluated. Regarding the state IFDM ranking, in 2005 Maracaju ranked 5th (0.7388) and 20th (0.7443) in 2016. Ponta Porã ranked 55th (0.5728) in 2005 and 54th (0.6686) in 2016, which are values much lower than the state average. Comparing the data for the municipalities, Maracaju's General IFDM increased by 0.74%, while Ponta Porã's increased by 16.7%. Despite these data, Maracaju had a higher index, although the growth was not incredibly significant and maintained its moderate development classification, while Ponta Porã, despite its greater increase in the General IFDM, continues to have a low classification. Thus, the socioeconomic development was moderate for both municipalities. The Central-West and South regions have the highest percentage of IFDM in municipalities with high or moderate development, which were 24.8% and 27.4%, respectively (FIRJAN, 2018b), although there are discrepancies between the
regions.
The Employment & Income IFDM indicated significant fluctuation with Maracaju, despite the fluctuations, remaining with moderate development, changing to regular development only in 2008. Ponta Porã, in 2005, 2006, 2008 and 2011, achieved regular
development, moving to moderate development in 2007, 2009, 2010, 2012, 2013 and 2014,
indicating progress. In 2015 and 2016 there was a retraction (2014 = 0.6075 and 2016 = 0.4608), returning to regular development. However, in 2012 it reached 0.6612, reaching the best development in this dimension, while the best year for Maracaju was 2010 (0.7782). Rossi and Gimenez (2017) reported that there was a negative variation in the Employment & Income IFDM in several municipalities of Mato Grosso do Sul, representing more than 2/3 of the municipalities, a situation explained, in part, due to the economic recession that occurred in 2015 and 2016, in which almost three million formal jobs were closed, a decisive factor in interrupting the socioeconomic development trajectory of the municipalities.
Thus, in 2005, in the state ranking, Maracaju came in 5th place and Ponta Porã, in 38th place. In the national ranking, Maracaju came in 283rd place and Ponta Porã, 1,590th. In 2016, in the state ranking, Maracaju came in 18th place and Ponta Porã, 62nd. In the national ranking, Maracaju came in 610th place and Ponta Porã, 2,620th, demonstrating that Maracaju had better socioeconomic development in the Employment & Income dimension, although both have shown a significant drop in positions in more recent years.
It took Brazil seven years to include 103 municipalities in the moderate or high development group in the Employment & Income dimension, however, in just three years of crisis, 936 municipalities fell from these categories, with municipalities in Mato Grosso do Sul being no exception (FIRJAN, 2018b). The results also showed that the economic crisis had an impact on the Education & Health indicators (Figures 3A and 3B). Thus, Brazil was unable to achieve the established goals, such as adequate prenatal coverage and childhood education, a situation often linked not to a lack of resources but rather to the competent management of these resources (FIRJAN, 2018b).
The Education & Health dimensions contribute to the socioeconomic development of municipalities, as education is considered the driving force behind economic development and growth, as well as a fundamental resource for the affirmation of citizenship and the construction of democracy (Lobão & Silva, 2015). Municipalities with the best educational and health management structures present better results related to health conditions, in addition to good employability (Ribeiro & Zuccolotto, 2012).
The Education IFDM for Maracaju (Figure 3A) was of moderate development, while for Ponta Porã (Figure 3B), between 2005 and 2006, it was of regular development, with growth of the indicator between 2007 and 2015 (moderate development) and 2016, high stage of development (0.8038). 2016 was the year in which education advanced the least (0.6%) in the last decade, with the indicators that make up the Education IFDM far from the goals defined in the National Education Plan, with the country reaching only 80.4% in preschool attendance and 27.4% access to daycare, values well below those defined by MEC (FIRJAN, 2018b).
In relation to the state ranking, in 2005, Maracaju came in 18th place and Ponta Porã, 46th. In the national ranking, Maracaju was in 1,938th place and Ponta Porã, 2,735th. In the 2016 state ranking, Maracaju came in 31st place and Ponta Porã, 16th. In the national ranking, Maracaju came in 2,731st place and Ponta Porã, 2,320th. The results show that both achieved moderate development, although Maracaju showed a significant drop in its indexes, with a worsening in the state and national ranking, with Ponta Porã improving its score.
The Health IFDM variable for Ponta Porã (Figure 3B) indicated gradual growth of 30.1%, changing the classification from regular development to moderate development, a significant difference in level. For Maracaju (Figure 3A), the moderate classification prevailed, despite the indicator's growth rate of 1.5%, demonstrating a trend of improvement over time. However, Maracaju obtained an index above 0.800, better than the index for Ponta Porã, with a value below 0.800.
In terms of state rankings, in 2005 Maracaju ranked 14th and Ponta Porã ranked 61st. In the national ranking, Maracaju ranked 769th and Ponta Porã ranked 3,059th. In 2016, in the state ranking, Maracaju ranked 28th and Ponta Porã ranked 59th. In the national ranking, Maracaju ranked 2,231st and Ponta Porã ranked 3,617th, showing that there was a decline in the health dimension for both, with Maracaju showing the greatest decline. This situation shows that Brazil needs to invest more in public policies to improve the Health IFDM (FIRJAN, 2018b).
The Economic Growth Level Index – INC
In relation to the INC, growth can be considered as the capacity of a country to offer its population increasingly diversified goods and services, based on technological advances and institutional changes. Furthermore, growth is measured by the evolution of the national product, which can be in the sphere of the GDP per capita. Another perspective defines growth as an increase in the production of goods and services, identified by the increase in GDP and the level of labor employed, national income and/or technological advance (Hersen et al., 2010).
Thus, the INC determines the level of growth in comparison to the state average (Piacenti, 2016) and the results (Figure 4) demonstrate that Maracaju obtained a Significant classification, which indicates a GDP per capita higher than the state average GDP per capita. Despite this classification, there was a drop in the growth level of 19.0% (2005 to 2012) and 18.7% (2012 to 2019). Ponta Porã received a High rating, but its growth level was lower than the state average, with a decrease in the indicator from 2005 to 2012 (7.3%) and an increase from 2012 to 2019 (17.7%). Piacenti et al. (2012) write that according to the INC, taking the average GDP per capita as a basis, regions with an indicator above 100 had a higher GDP and the other regions had a lower GDP. In other words, Maracaju stood out in this regard.
Figure 4 - Economic Growth Level Indicator (EGLI %) of Maracaju and Ponta Porã, Mato Grosso do Sul, to the years 2005, 2012, and 2019.
Source: IBGE (2021b).
GDP is the main indicator used to measure the economic growth of a region, and micro and/or macro analysis can be used to assess growth. However, there are several criticisms to this regard, not taking into account the development of the area, that is, the distribution of income and the quality of life of the population (Fernandes, Tavares & Azevedo, 2018). There is evidence that the economic performance of countries has a major influence on their human development; however, the determinants of development are very heterogeneous, and the GDP may not be the main factor in this condition (Gaygisiz, 2013). Thus, to consider these variables, GDP per capita is the GDP divided by the number of inhabitants of the spatial scope adopted, during the period chosen for the analysis (Santa Catarina, 2013).
The understanding of the development process evolves over time, going beyond the exclusive logic of increased production and wealth to include how these are reflected in the well-being of society. This evolution will affect, among other things, the constructed notion of socioeconomic development, also implying the reformulation of the ways of measuring the process. If initially the concept of development was associated only with economic growth and could be measured by the GDP, in a broader conception it was necessary to add new variables to the indicators, which address issues in the areas of education, housing and health, to better define the socioeconomic development (Siedenberg, 2003).
Regarding the municipal GDP, its calculation is based on a descending process of distribution among municipalities, referring to the value of 15 activities, namely: Agriculture, Industry, Mineral extraction, Manufacturing industry, Civil construction, Industrial services of public utility, Commerce, Transport, Accommodation and food services, Communications, Financial services, Public administration, Rent and services provided to companies, Education and health, and Other services and domestic services (IBGE, 2004). In this sense, economic development can be seen as economic growth and is accompanied by improvements in the standard of living of citizens and by structural changes in the economy, observed over time by the positive variation in economic growth measured by indicators of income GDP or GDP per capita, as well as in the reduction of levels of poverty, unemployment and inequality and improvement in the levels of health, nutrition, education, housing and transportation (Souza, 2011).
The municipal gross GDP per capita (Figure 5) showed economic growth, and Maracaju, between 2005 and 2010, had an increase of 33.0%; between 2010 and 2015, 60.3%; and, in 2015 and 2019, 13.4%. In Ponta Porã, between 2005 and 2010 there was growth of 55.7%; 2010 and 2015, 93.0%; and, in 2015 and 2019, 33.6%. The results indicate that Maracaju, throughout the period evaluated, obtained better growth than Ponta Porã.
Figure 5 - Gross Domestic Product per capita of Ponta Porã and Maracaju, Mato Grosso do Sul, from 2005 to 2019.
Source: IBGE (2021b).
GDP per capita, despite its importance, does not reveal important factors, such as income distribution, quality of life, education and health, and indicates only the sum of all final goods and services produced, divided by the population, as if everyone received equal shares (IBGE, 2021b), which is not the case. Several factors affect the development of a region, such as the social, political and economic structure, which can allow for an increase in the community's standard of living (Vieira, Albert & Bagolin, 2008). Thus, the higher the GDP, the greater the population's productive capacity and, consequently, the more apt is the region in terms of capital accumulation, which favors its advancement in the process of economic development (Lima, Piffer & Ostapechen, 2016).
Mato Grosso do Sul has an economy based on the agro-industrial chain and commodity exports, with a GDP per capita correlated with agribusiness, which increases the income of the population in municipalities dedicated to this type of activity (Silva et al., 2024). Thus, they depend on productive dynamics to sustain economic development, as observed by Constantino et al. (2019). The two municipalities evaluated are part of one of the main state’s economic microregions (microregion of Dourados, which comprise Maracaju and Ponta Porã), with a GDP per capita, in 2010 and 2019, of R$ 19,271.77 and R$ 42,371.11, respectively, with values that represent 23.1% of the state’s GDP, occupying 4th position in value of the regional GDP per capita (SEMAGRO, 2021).
However, Maracaju and Ponta Porã showed variations in the regional contribution to the GDP per capita between 2010 and 2019. In Maracaju, R$ 29,773.00 → 54,120.27 (growth of R$ 24,347.27 and an increase of 45%) and Ponta Porã, R$ 13,490.03 → 34,790.71 (growth of R$ 21,300.68 and an increase of 61.2%), while the state’s average was R$ 19,637.44, indicating values higher than the state’s, with emphasis on Maracaju (SEMAGRO, 2021).
The studies by Constantino et al. (2019), analyzing the period from 2010 to 2015, through the Cluster Analysis of the GDP per capita of the municipalities of Mato Grosso do Sul, demonstrated that one of the municipalities responsible for the growth was Maracaju, standing out with an increase of more than 70.0% and, according to SEMAGRO (2021), as an agricultural hub, which confirms the results obtained by this research. In this context, Maracaju demonstrates outstanding behavior in relation to the GDP per capita, with an increase in its wealth from agribusiness, differentiating itself from the other municipalities, which is confirmed by Constantino et al. (2019), with its economy based on different agricultural production dynamics, presenting one of the best economic growth rates in the state (SEMAGRO, 2021).
The Regional Disparity Index (ID)
The ID, measured by the IFDM, allows the assessment of the socioeconomic development (Mantovani et al., 2020) and indicated that in Maracaju, the ID (Figure 6A) has a good performance, being classified, in relation to the years from 2005 to 2016, mostly convergent to the dynamic (ID > 0.40) or tending to converge in 2007 (ID > 0.37). The exception was 2008 (divergent from the most dynamic or stagnant), when Maracaju was inert, that is, without any socioeconomic development.
Figure 6 - Disparity Index of Maracaju (A) and Ponta Porã (B), Mato Grosso do Sul, from 2005 to 2016.
Source: the authors.
The ID makes it possible to understand and compare the socioeconomic development of the municipalities, and Maracaju (Figure 6A) converges to dynamism for all of the years (except 2008). Ponta Porã (Figure 5B) showed convergence to the socioeconomic development, although 2005 and 2006 indicate an ID that diverged from the most dynamic or stagnant (inert), not achieving any development. From 2007 (convergent to the most dynamic) and 2008 (tending to convergence), all IDs were convergent to the most dynamic (convergence to greater development).
Initially, Maracaju presented the best indexes, being surpassed by Ponta Porã in 2014, 2015 and 2016. If the ID is higher, the situation of the municipality is better, as it indicates convergence of the General IFDM in comparison to the most developed one. This implies a reduction in differences and better development (Oliveira & Lima, 2021), which can occur due to investments in health, education and economic development made by municipal administrations (Silva & Lima, 2021). Thus, periods with low municipal investment in certain areas lead to a decrease in the ID and according to the classification proposed by Raiher and Lima (2014), the results obtained point to a General IFDM converging to the most dynamic, demonstrating that throughout the period evaluated, the socioeconomic development improved. Efficient management in the public sector concerns the achievement of the results obtained from the goals set, meaning lower costs, a greater degree of commitment to society and improvements in the manager's management practices, among several variables of public administration that can be used to measure whether the actions performed make management efficient. In this way, the application of the resources available in the municipal budget, in parallel with the results obtained, demonstrates the efficiency of the manager with regard to the process of managing public resources, with its form of application allowing for an improvement in the ID, leading the manager to perceive whether the goals and objectives set are in line with
the desires of society (Brasil, 2014).
Thus, the results demonstrate that agribusiness has a relative influence on the economy of Mato Grosso do Sul, and this influence causes positive and negative externalities. Positive in the sense that agribusiness can contribute to increased income and wealth generation, and negative, because when the sector is at a slower pace of production, the other sectors perceive a reduction in its inductive effect (Frainer et al., 2018), leading to losses in the population's quality of life.
4 Final considerations
There has been an improvement in the living conditions, reflecting municipal development through economic growth. Despite this, social inequalities still exist, and, in this sense, the ID positions the municipalities as convergent with the most dynamic in relation to quality of life. Even with these results, the Employment & Income variable of the IFDM showed a drop in growth in both locations. Thus, the indicators obtained can contribute to assisting public managers in decision-making and in the application of public resources, for the benefit of the population's well-being.
Economic growth has always been positive for both municipalities, with Maracaju standing out in terms of the GDP per capita, due to agricultural production, its main economic activity for tax collection. Thus, both municipalities contribute to the increase in the state's GDP per capita, with Maracaju standing out in agribusiness and demonstrating the importance of the activity that contributes to the increase in wealth and income generation. Despite the growing evolution of the GDP per capita, the consolidated IFDM and its dimensions, in addition to the HDI-M, showed different development, which demonstrates that the growth of the GDP per capita may not result in the improved quality of life.
5 Acknowledgements
The authors would like to thank Anhanguera-Uniderp University for its support and the National Council for Scientific and Technological Development (CNPq) for the Research Productivity Grant (PQ 1C). This study was carried out with the support of the Coordination for the Improvement of Higher Education Personnel in Brazil (CAPES) - Financing Code 001 and the Anhanguera-Uniderp University through the payment of a scholarship.
6 References
Anastácio, S. S., Vieira, N. M., & Amaral, T. P. (2021). O desenvolvimento dos municípios da microrregião de São João Del-Rei/MG: uma análise para o período 2005/2015. Revista de Desenvolvimento Socioeconômico em Debate, 7(2), 146-164.
https://doi.org/10.18616/rdsd.v7i2.6515
ATLAS Brasil. Atlas do Desenvolvimento Humano no Brasil, Consulta. 2021. Recuperado de: http://www.atlasbrasil.org.br/consulta
Barbosa, F. R. G. M. (2017). Índice de Desenvolvimento Relativo, IDH-M e IFDM: em busca da operacionalização das liberdades instrumentais de Amartya Sem. Ensaios FEE, 38(2), 295-328. Recuperado de: https://revistas.planejamento.rs.gov.br/index.php/ensaios/article/viewFile/4073/3925
Belarmino, O. M., & Vieira, R. M. (2020). Desenvolvimento fronteiriço: Uma análise dos indicadores socioeconômicos da região de planejamento Sul Fronteira/MS. In Anais da III Colóquio Internacional Dinâmicas de Fronteiras, Toledo, Pr.
Begnini, S., & Almeida, L. E. D. F. (2016). Grau de desenvolvimento regional dos municípios da mesorregião Oeste Catarinense: caracterização e classificação. Interações, 17(4), 547-
560. http://dx.doi.org/10.20435/1984-042X-2016-v.17-n.4(01)
Brasil. (2014). Ministério da Educação e do Desporto. Secretaria de Educação Básica. Relatório de gestão exercício ano 2013. Brasília: MEC.
Caldarelli, E. C., Camara, M. R. G., & Perdigão, C. (2015). Instituições de Ensino Superior e Desenvolvimento Econômico: o caso das universidades estaduais paranaenses. Repositório do Conhecimento do IPEA, 2015. Recuperado de: http://repositorio.ipea.gov.br/handle/11058/4144
Constantino, M., Dorsa, A. C., Boson, D. S., & Mendes, D. R. F. (2019). Caracterização econômica dos municípios sul-mato-grossenses do Corredor Bioceânico. Interações, 20(especial), 179-192. http://dx.doi.org/10.20435/inter.v20iespecial.2119
Corrêa, A. S., & Duarte, V. M. (2022). Desenvolvimento socioeconômico nos municípios catarinenses: o que mostram os indicadores? Redes, 27, 1-19. https://doi.org/10.17058/redes.v27i.16579
Diniz, J. A., Macedo, M. A. S., & Corrar, L. J. (2012). Mensuração da eficiência financeira municipal no Brasil e sua relação com os gastos nas funções de governo. Gestão & Regionalidade, 28(83), 5-20. https://doi.org/10.13037/gr.vol28n83.1347
Fernandes, R. B., Tavares, A. L., & Azevedo, Y. G. P. (2018). Relação entre o valor adicionado das atividades econômicas e o produto interno bruto do Rio Grande do Norte. Race: Revista de Administração, Contabilidade e Economia, 17(2), 757-782.
http://dx.doi.org/10.18593/race.v17i2.17238
Frainer, D. M., Souza, C. C., Reis Neto, J. F., Castelão, R. A., & Rosa, M. (2018). A mensuração do Produto Interno Bruto do agronegócio de Mato Grosso do Sul. Revista de Ciências Agrárias, 41(4), 1135-1145. Recuperado de: https://revistas.rcaap.pt/rca/article/view/16791/13676
FIRJAN. Federação das Indústrias do Estado do Rio de Janeiro. (2018a). Metodologia Índice FIRJAN de Desenvolvimento Municipal - IFDM. Rio de Janeiro: FIRJAN. Recuperado de: https://firjan.com.br/data/files/E8/06/F0/D5/58E1B610E6543AA6A8A809C2/Metodologia
%20IFDM%20-%20Final.pdf
FIRJAN. Federação das Indústrias do Estado do Rio de Janeiro. (2018b). Índice FIRJAN de desenvolvimento municipal: Série História 2010 - 2016. Rio de Janeiro: FIRJAN. Recuperado de: https://firjan.com.br/ifdm/downloads
Gaygisiz, E. (2013). How are cultural dimensions and governance quality related to socioeconomic development? The Journal of Socio-Economics, 47, 170-179.
https://doi.org/10.1016/j.socec.2013.02.012
Gil, A. C. (2017). Como elaborar projetos de pesquisa. 6ed. São Paulo: Atlas.
Hauner, D., & Kyobe, A. (2010). Determinants of government efficiency. World Development,
38(11), 1527-1542. https://doi.org/10.1016/j.worlddev.2010.04.004
Hersen, A., Lima, J. F., Santos, A., & Lima, C. (2010). As fontes do crescimento econômico das cidades médias do Estado do Paraná. Revista de História Econômica & Economia Regional Aplicada, 5(8), 1-20.
IBGE. Instituto Brasileiro de Geografia e Estatística. (2004). Produto Interno Bruto dos Municípios: série relatórios metodológicos, v. 29. Rio de Janeiro, IBGE.
IBGE. Instituto Brasileiro de Geografia e Estatística. (2021a). Cidades e Estados. Rio de Janeiro. Recuperado de: https://www.ibge.gov.br/cidades-e-estados/ms/maracaju.html
IBGE. Instituto Brasileiro de Geografia e Estatística. (2021b). Produto Interno Bruto - PIB. Rio de Janeiro. Recuperado de: https://www.ibge.gov.br/explica/pib.php
Lima, J. F. de (2019). As disparidades regionais na fronteira sul do Brasil. Revista Brasileira de Gestão e Desenvolvimento Regional, 15(5), 128-137. Recuperado de: https://www.rbgdr.net/revista/index.php/rbgdr/article/view/5035/823
Lima, J. F. de, Piffer, M., & Ostapechen, L. A. P. (2016). O crescimento econômico regional de Mato Grosso do Sul. Interações, 17(4), 757-766. https://doi.org/10.20435/1984-042X-2016-v.17-n.4(16)
Lobão, M. S. P., & Silva, R. G. (2015). Desenvolvimento educacional municipal do estado do Acre: uma avaliação dos anos de 2000 e 2010. Revista Brasileira de Gestão e Desenvolvimento Regional, 11(2), 116-137. https://doi.org/10.54399/rbgdr.v11i2.1772
Mantovani, G. G., Ruths, J. C., Souza, M. P. R., Ferreira, R. L. A., Carrelan, R., Mattei, T. S., & Camargo, W. S. (2020). A dinâmica do desenvolvimento socioeconômico dos municípios da faixa de fronteira brasileira. In Lima, J. F. de (Org.). Desenvolvimento regional fronteiriço no Brasil. (v. 1, p. 35-113). Toledo: Núcleo de Desenvolvimento Regional – UNIOESTE.
Mattei, T. F., Bezerra, F. M., & Mello, G. R. (2018). Despesas públicas e o nível de desenvolvimento humano dos estados brasileiros: uma análise do IDHM 2000 e 2010. RACE: Revista de Administração, Contabilidade e Economia, 17(1), 29-54. http://dx.doi.org/10.18593/race.v17i1.10296
Mendes, W. A., Bomeny, H. M. B., & Costa, V. M. R. (2018). Análise do desenvolvimento humano e o contexto multidimensional. Revista Internacional de Investigación en Ciencias Sociales, 14(2), 97-108. https://doi.org/10.18004/riics.2018.diciembre.097-108
Mukokoma, M. M. N., & Dijk, M. P. (2013). New public management reforms and efficiency in urban water service delivery in developing countries: blessing or fad? Public Works Management & Policy, 18(1), 23-24. https://doi.org/10.1177/1087724X12459043
Oliveira, C. (2024). Conheça os 10 municípios mais ricos da agricultura de MS. Disponível em: https://www.aprosojams.org.br/blog/conhe%C3%A7a-os-10-munic%C3%ADpios-mais-ricos-da-agricultura-de-ms. Acesso em: 20 nov 2024.
Oliveira, O. F., & Lima, J. F. de (2021). Desenvolvimento regional diferenciado no Seridó brasileiro. Revista de Economia Regional Urbana e do Trabalho, 10(1), 129-150. https://doi.org/10.21680/2316-5235.2021v10n1ID23796
ONU. Organização das Nações Unidas. (2013). Relatório do Desenvolvimento Humano - RDH. Programa das Nações Unidas para o Desenvolvimento. Recuperado de: http://www.pnud.org.br/arquivos/rdh-2013.pdf
Passos, C. R., & Passos, G. O. (2024). Arrecadação de impostos dos municípios brasileiros na vigência da Constituição Federal de 1988: anos 2003 a 2019. Gestão & Regionalidade, 40, e20248231. https//doi.org/10.13037/gr.vol40.e20248231
Pereira, C. A., & Ávila, L. A. C. (2023). A Influência das Receitas Tributárias Municipais e dos Gastos com Saúde e Educação na Qualidade da Gestão Municipal no Estado de Minas Gerais. In Anais do Congresso Brasileiro de Custos, São Paulo, SP.
Piacenti, C. A. (2016). Indicadores do potencial de desenvolvimento endógeno dos municípios paranaenses, no período 1999/2013. Foz do Iguaçu: Parque Itaipu.
Piacenti, C. A., Lima, J. F. de, Alves, L. R., Piffer, M., & Rippel, R. (2012). Análise Regional: metodologias e indicadores. Curitiba: Camões.
Pinto, D. G., Costa, M. A., & Marques, M. L. A. (2013). O Índice de Desenvolvimento Humano Municipal Brasileiro. Brasília: PNUD/IPEA/FJP.
PNUD/IPEA/FJP. Programa das Nações Unidas para o Desenvolvimento, Instituto de Pesquisa Econômica Aplicada, Fundação João Pinheiro. (2013). Índice de Desenvolvimento Humano Municipal Brasileiro. Brasília: PNUD/Ipea/FJP. (Atlas do Desenvolvimento Humano no Brasil).
Postali, F. A. S., & Nishijima, M. (2011). Distribuição das rendas do petróleo e indicadores de desenvolvimento municipal no Brasil nos anos 2000. Estudos Econômicos, 41(2), 463-485. https://doi.org/10.1590/S0101-41612011000200010
Prefeitura Municipal de Maracaju/MS. (2024). Conheça Maracaju. Disponível em: https://www.maracaju.ms.gov.br/turismo/conheca-maracaju. Acesso em: 20 nov 2024.
Prefeitura Municipal de Ponta Porã/MS. (2024). Ponta Porã. Disponível em: https://pontapora.ms.gov.br/v2/. Acesso em: 20 nov 2024.
Raiher, A. P., & Lima, J. F. de (2014). Desenvolvimento humano municipal no Sul do Brasil: evolução recente e o círculo vicioso da pobreza. Acta Scientiarum. Human and Social Sciences, 36(2), 147-54. https://doi.org/10.4025/actascihumansoc.v36i2.24809
Ribeiro, C. P. P., & Zuccolotto, R. (2012). Determinantes da transparência na gestão pública dos municípios brasileiros. In Anais do 5º. Encontro de Administração Pública e Governo, da ANPAD, Salvador, BA.
Rocha, L. E. V., & Carvalho, T. (2015). Desenvolvimento humano e convergência de renda: evidências para a região Nordeste do Brasil no período de 1991 a 2010: coletânea de artigos. Prêmio Atlas do Desenvolvimento Humano no Brasil. Brasília: PNUD: IPEA: FJP.
Rossi, P. L., & Gimenes, D. M. (2017). Crise econômica e o mercado de trabalho no Brasil. Revista do Tribunal Regional do Trabalho da 15ª Região, 51(1), 23-61. Recuperado de: https://trt15.jus.br/sites/portal/files/fields/colecoesdotribunal_v/revista-do-tribunal-eletronica/2017/r-51-2017.pdf (2017)
Santana, A. S., & Barreto, R. C. S. (2017). Análisis descriptivo y econometrico del indicador de calidade Institucional de los municipios brasileños. Compendium, 4(9), 53-83. Recuperado de: http://www.revistas.espol.edu.ec/index.php/compendium/ article/view/252
Santa Catarina (Estado). (2013). Secretaria de Estado da Fazenda. Caderno de Indicadores –
Santa Catarina e suas Regiões 2013. Florianópolis: SEFAZ.
Schwartzman, S. (2006). Educação e pobreza no Brasil. Cadernos ADENAUER, 2, 9-38.
SEMAGRO. Secretaria de Estado de Meio Ambiente, Desenvolvimento Econômico, Produção e Agricultura Familiar. (2021). Bases de dados – Produto Interno Bruto dos Municípios de Mato Grosso do Sul - 2010-2019. Campo Grande: SEMAGRO.
Sen, A. K., Motta, L. T., & Mendes, R. D. (2000). Desenvolvimento como liberdade. São Paulo: Companhia das Letras.
Siedenberg, D. R. (2003). Indicadores de desenvolvimento socioeconômico: uma síntese.
Desenvolvimento em Questão, 1(1), 45-71. http://dx.doi.org/10.21527/2237-
6453.2003.1.45-71
Silva, A. R., Dal Moro, O. F., Centenaro, M., & Vieira, R. M. (2024). The dynamics of industrial employment in Mato Grosso do Sul (2009-2019). Gestão & Regionalidade, 40, e20248347. https//doi.org/10.13037/gr.vol40.e20248347
Silva, J. S., & Lima, J. F. (2021). O desenvolvimento socioeconômico dos municípios da mesorregião diferenciada de Águas Emendadas. Interação – Revista de Ensino Pesquisa e Extensão, 23(1), 61-77. http://dx.doi.org/10.33836/Interação.v23i1.499
Souza, N. J. (2011). Desenvolvimento Econômico. 6ed. São Paulo: Atlas.
Vieira, C. R., Albert, C. E., & Bagolin, I. P. (2008). Crescimento e desenvolvimento econômico no Brasil: Uma análise comparativa entre o Produto Interno Bruto per capita e os níveis educacionais. Análise – Revista de Administração da PUCRS, 19(1), 28-50.
Torres, H. G., & Dias, E. C. (2016). A política habitacional e a metrópole: exclusão e inclusão dos mais fracos? 1ª Análise Seade, 37, 3-35. Recuperado de: https://produtos2.seade.gov.br/wp-content/uploads/2016/05/primeiraanalise.n.37abr2016
Trevisan, E. S., & Lima, J. F. de (2010). Crescimento e desigualdade regional no Paraná: Um estudo das disparidades de PIB per capita. Ciências Sociais em Perspectiva, 9, 25-45. https://doi.org/10.48075/revistacsp.v9i16.2306
i Mestrado em Produção e Gestão Agroindustrial, Universidade para o Desenvolvimento do Estado e da Região do Pantanal, (Campo Grande/MS). Doutorado em Meio Ambiente e Desenvolvimento Regional, Universidade Anhanguera - Uniderp, Campo Grande/MS.
ii Mestrado em Ecologia e Recursos Naturais - Universidade Federal de São Carlos (1993) e doutorado em Ciências
- Universidade Federal de São Carlos (1996), São Carlos/SP.
iii Mestrado (1995) e doutorado (2010) em Química pela Universidade Estadual de Maringá, Maringá/PR.