Business commitment to Project management processes, case study of SMEs in Pasto (Colombia)
Compromisso empresarial com processos de gestão de projetos, estudo de caso de PMEs em Pasto (Colômbia).
Bolívar Arturo Delgado1*, ORCID: https://orcid.org/0000-0003-1905-7173; Hugo Fernando Ceballos Gómez 21, ORCID: https://orcid.org/0000-0002-0451-1583
1. Universidade Mariana, Departamento de Nariño, Pasto, Colômbia. E-mail: barturo@umariana.edu.co.
2. Universidade Mariana, Departamento de Nariño, Pasto, Colômbia. E-mail: hceballos@umariana.edu.co.
*Autor correspondente: barturo@umariana.edue-co; carrera 28 Número 3 Oeste 35 Pasto, Colombia, CEP 520002.
Abstract
Project management associated with closure processes, covering initiation, planning, execution, monitoring, control and closure. In addition, it includes the management of time, costs and, consequently, changes or delays in specific areas that can impact the project, all the more so considering the common difficulties faced by entrepreneurs in Small and Medium-sized Enterprises (SMEs) in four areas: administrative, operational, external and strategic factors. The lack of project management practices in SMEs is attributed to the scarcity of resources, lack of knowledge, training and experience in the discipline. In order to address this gap, this article makes proposals for organizational management, based on the perception of the low levels of commitment identified. The researcher's approach is based on the quantitative paradigm, with the aim of assessing companies' commitment to applying project management processes, using 10 different scenarios.
Keywords: Project management; Business commitment; SMEs.
Resumo
Gestão de projetos associada aos processos de encerramento, abrangendo iniciação, planejamento, execução, monitoramento, controle e encerramento. Além disso, inclui a gestão do tempo, custos e, consequentemente, alterações ou atrasos em áreas específicas que podem impactar o projeto, ainda mais levando em consideração as dificuldades comuns enfrentadas por empreendedores de Pequenas e Médias Empresas (PMEs) em quatro áreas: administrativa, operacional, fatores externos e estratégicos. A falta de práticas de gestão de projetos nas PMEs é atribuída à escassez de recursos, falta de conhecimento, formação e experiência na disciplina. Para abordar essa lacuna, o presente artigo tem como propostas para a gestão organizacional, baseadas na percepção dos baixos níveis de comprometimento identificados. A abordagem da pesquisadora se fundamenta no paradigma quantitativo, visando avaliar o comprometimento das empresas na aplicação dos processos de gerenciamento de projetos, utilizando 10 cenários distintos.
Palavras-chave: Gerenciamento de projetos; Compromisso empresarial; smes
Citação: Arturo, D.B., & Ceballos G. H. (2024). Compromisso empresarial com processos de gestão de projetos, estudo de caso de PMEs em Pasto (Colômbia). Gestão & Regionalidade, v. 40, n. Especial: Regionalidade e desenvolvimento: o papel da gestão, e20249082. https//doi.org/10.13037/gr.vol40.e20249082
1 Introduction
SMEs have become a relevant pillar within economies; they are a fundamental part of the economic system; they stimulate the economy and have a great social responsibility. Okpara and Wynn (2007), Vega, Castaño and Mora (2011) stated that small businesses are considered the driving force of economic growth, not only for the generation of employment, poverty reduction and wealth generation, but also for their contribution in income distribution, market dynamizer, among other aspects; ten years later, according to Moncayo (2017), this statement is still valid: "small and medium-sized enterprises are ratified as the locomotives of the country, not only for their contribution to employment, but also because their smaller size allows them to better weather the slowdown" (para. 1).
On the other hand, and due to the special nature of projects, their complexity and diversity, project management is an essential tool to manage them; the success or failure of the project depends on its appropriate or inappropriate management. The absence of planning generates deficiencies in time, costs and quality. Díaz (2015), states that the management profiles that impede growth and sustainability in organizations are related to the most common errors in the investment and execution of project planning and programming, questioning the role and skills of project management, methodology used, risk management, teamwork, environmental factors and change management.
The understanding and commitment of administration in project management in SMEs will be useful to generate change, this allows to establish strategies and, with them, appropriate methodologies to provide solutions to existing problems, creating opportunities to improve competitiveness levels. Hence the importance of managing projects overcoming risks and bottlenecks and generating conditions that allow human talent development, growth and not processes aimed at simple supervision.
To counteract economic losses, companies currently operate at an extremely competitive pace that requires them to be constantly changing, not only in their processes but also in their physical, financial and personnel structures. These changes must be made due to regulations or laws that oblige them to do so, or simply to remain in the sector. In the best of cases, to be leaders in that sector (Ceballos, 2022), it is for this reason that the business reality outlines goals and challenges that, in most cases, in those competitive productive units are met given the appropriate conditions of physical, technological, intellectual and service capacity, these challenges and goals require the preparation and planning of strategies that allow them to be met and for this it is necessary to have all the synergies belonging to each organization project management requires the efficient and effective administration of internal and external processes, for which knowledge, capabilities and skills are required to ensure the fulfillment of objectives with control adjusted to time, cost and scope; hence the importance of the skills that, according to Daccach (2018), guarantee its development: project definition, work planning, contract administration, work plan, scope, risks, communication, quality, stakeholders, aspects that are not taken into account by entrepreneurs of SMEs in the city of Pasto. The administration has an empirical approach; generally, it is managed by the owners themselves, who do not have knowledge in administrative, financial, commercial and management matters, nor do they have specialized technical personnel. As a result, there is evidence of an administration based on experience, without having the appropriate personnel and lacking an organizational culture oriented to project management, limiting planning for the development of various business projects.
On the other hand, statistics from specialized companies such as Gartner (cited by Ardila, 2015), state that only 20% of the projects end, obtaining the proposed objective, both in terms of time and estimated resources. Eighty percent of collaborative projects do not end; this generates an increase in direct costs (in cases where projects end with greater resources than expected) and indirect costs, due to the non-availability of expected benefits that the project would provide if it had ended on time and at cost. This is reaffirmed by the 2015 Chaos Report (The Standish Group International Inc. 2015), which indicates that 29% (out of 50,000 analyzed worldwide) are successful, i.e. they meet deadlines, budget and, in addition, obtain satisfactory results.
In this context, the present work aims to analyze the level of commitment of SME entrepreneurs to project management processes; commitment being understood as the agreement assumed by those involved in the planning process for the achievement of some future activity or action. that allow, as stated by Mazurkiewicz (2018), to improve knowledge, innovate, make continuous improvements, open new markets and internationalize, or collaborate with other companies and institutions in projects. It is worth noting that this type of studies in SMEs is quite limited (Arturo & Díaz, 2021).
2 Review of literature
Different countries have gradually become part of the dynamics of globalization, productivity and competitiveness, factors that are of concern to the private and public sectors. Productivity and competitiveness are closely related; thus, while the former refers to a company's capacity to produce with lower costs and better technologies, the latter refers to a company's capacity to enhance its productivity in order to compete successfully at the national and international levels.
Therefore, a country, region, company or sector that wishes to achieve success, and in the particular case of SMEs in the city of Pasto, must be productive and competitive; that is, they must have a set of internal and external qualities that allow them to generate sustained value in the market, to face new paradigms from a strategic point of view. To this end, they have, on the one hand, management processes that constitute a determining element of the quality of the performance of any organization, and affect the optimal use of human talent; and, as mentioned by Amat (2007), this refers to the development of the basic functions of administration: planning, organizing, directing and controlling, generating efficiency, effectiveness, productivity and, naturally, competitiveness.
On the other hand, with project processes that incorporate five groups: 1) Initiation, defines and authorizes a project or phase thereof; 2) Planning, establishes the scope, defines and refines objectives and the course of action necessary to achieve the proposed objectives; 3) Execution, integrates people, resources to carry out the project requirements; 4) Monitoring and Control, is responsible for monitoring, analysis and regulation of project progress and performance to identify the need for changes and 5) Closing, seeks the formality of acceptance of the project, phase or contract (Pmbook 2017). (Pmbook 2017). This allows the appropriate analysis of scopes and times that guarantee the fulfillment of objectives outlined with quality, on time and with stipulated costs based on assigned tasks.
2.1 Project Management Conceptualization
Table 1 lists some concepts presented by authors and concepts proposed by institutions internationally recognized as leaders in project research: International Project Management Association (IPMA), Project Management Institute (PMI), PRINCE2, among others; in them it can be inferred that the management, direction, or administration of projects (Project Management) generates an environment conducive to the achievement, scope and quality of the objectives set by the management, optimizing resources, promoting efficiency, effectiveness and mitigating risks.
Table 1
Project Management Conceptualization
|
Author |
Concept |
|
Project Management Institute, Inc. (2013 – 2017 - 2021) |
Project Management is the application of knowledge, skills, tools and techniques to project activities to meet project requirements. It is achieved through the proper application and integration of the project management processes identified for the project, and enables organizations to execute effectively and efficiently. |
|
ISO 21500 (2013) |
Application of methods, tools, techniques and competencies to a project. |
|
PMI (2008) |
Application of knowledge, skills, tools and techniques to project activities to meet project requirements. |
|
PRINCE (2009) |
Planning, supervision and control of all aspects of the project, as well as the motivation of the people involved in the project to achieve the project objectives, in terms of time, cost, quality and performance. |
|
De Heredia R. (2007) |
Process of optimizing the resources made available to the project in order to achieve its objectives. |
|
Lledó y Rivarola (2007) |
Project management is the application of knowledge, skills, tools and techniques to the activities necessary to achieve project objectives; its efficiency saves resources and facilitates the delivery of the final product in a timely manner. |
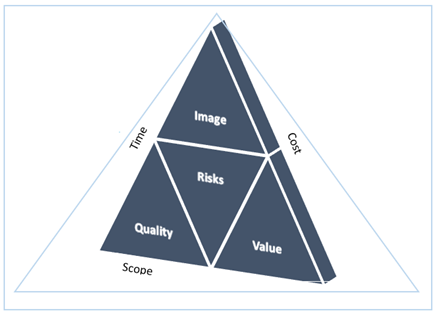
In this order of ideas, grouping the concept of project management and processes, project management is responsible for planning, organizing, directing and controlling three elements: scope, time and costs, hence the importance of the project triangle concept or called by Lledó and Rivarola (2007) as the 'triple project constraint', which currently incorporates other components as stated by Toro (2020) and the imbalance of them can affect the outcome of the entire project (Figure 1).
Figure 1
Graphical expression of the triple constraint
Source: Toro (2020)
Toro (2020) points out as the project manager's objective the need to balance the constraint triangle: staying within budget (keeps the project on track and avoids overspending), deadline (compliance with the schedule), and scope or project specifications (establishes limits and specifies deliverables), a balance that leads to minimize risks and maximize quality, image and business value. It is important to point out, on the one hand, the proportional relationship between scope and time and costs assigned to the project, and on the other hand, the inverse relationship between time and cost. Therefore, variations in these factors will positively or negatively affect the quality, image, value and risks of the project.
2.2 Project Management Methodologies
On the other hand, as shown in Table 2, project management methodologies present similar aspects and certain differences that allow satisfactory management of the achievement and scope of the project; it synthesizes objectives, processes, areas of knowledge and components that enable the use and diversity of good practices for the success of the company and good project management.
Table 2
Parallel project management methodologies
|
PMBOK |
PRINCE2 |
P2M |
ISO 10006:2003 |
GTC-ISO 21500 |
|
OBJECTIVES |
||||
|
Define sub set of best practices |
Cover organizational, management and control aspects |
Methodological guide and project management guidelines |
Regulates processes to manage a project (takes into account quality system) |
Guide project management |
|
PROCESSES |
||||
|
Start |
Start-up |
Project strategy management |
Planning, implementation and maintenance of the quality system |
Start |
|
Start |
||||
|
Project management |
||||
|
Planning |
Project initiation Product delivery management |
Management of project objectives |
Interdependence (facilitates planning) |
Planification |
|
Project management |
Project systems management |
|
Implementation |
|
|
Execution |
|
Project development and implementation process |
|
Performance of activities |
|
Monitoring and control |
Control of a phase |
Project |
|
|
|
Management of phase limits |
|
|
|
|
|
Closing |
Management of phase limits. |
|
|
Control and closure |
|
Closure of the project. |
||||
|
KNOWLEDGE AREAS |
||||
|
Integration |
Change management |
|
Processes of improvement actions |
|
|
Scope |
Planes, Business Case |
|
Interdependency Process |
Scope |
|
Schedule |
Calendar |
Project organization management |
|
|
|
Time |
Planes, Business Case |
|
Time process |
Time |
|
Cost |
Cost |
Project financial management |
Cost Process |
Cost |
|
Risk |
Risk |
Risk Management |
Risk process |
Risk |
|
Stakeholders |
|
|
|
|
|
COMPONENTS |
||||
|
Quality |
Quality |
|
|
|
|
Communication |
Control |
Project communications management
|
Communication process |
Communication |
|
Human Resources |
Organization |
Project relationship management
|
Personnel process, organizational structure with allocation of resources and responsibilities. |
|
|
|
|
Project information technology management |
|
|
|
Procurement |
|
|
Procurement Process |
Procurement |
|
|
|
Project value management |
|
|
2.3 Bibliographic trace SME research
Arturo and Diaz (2021), based on the literature search during the period 2000 - 2019, identified 221 articles with relevant information on research conducted in small and medium-sized enterprises (SMEs) at the international level. It highlights the low levels of research in strategic factors (13.57%) and specifically in the topic of project management (the subject of this article), which as shown in Table 3, only 2 articles were traced (0.90% of the factor), an aspect that evidences a gap in knowledge in the subject of research. Therefore, the need and importance of advancing research processes in the subject that allows generating an organizational culture, in which the planned change becomes a dynamizing factor in this type of organizations, and project management becomes the tool that allows reaching quality, cost and scheduled time requirements in each project (table 3).
Table 3
Bibliographic crawls SME research (2000 - 2019)
|
Factor |
Thematic |
Articles |
Total, factor |
Percentage |
|
Administrative |
ICT and innovation |
39 |
131 |
59.29 |
|
Administration |
36 |
|||
|
Human Resources |
29 |
|||
|
Accounting and financial |
27 |
|||
|
Operations |
Control and Quality |
19 |
30 |
13.57 |
|
Marketing |
7 |
|||
|
Entrepreneurship |
4 |
|||
|
External |
Internationality |
19 |
30 |
13.57 |
|
Networks - Associativity |
6 |
|||
|
Regulations |
5 |
|||
|
Strategic |
MANAGE |
25 |
30 |
13.57 |
|
Strategic Thinking |
3 |
|||
|
Project Management |
2 |
|||
|
Total |
- |
221 |
221 |
100 |
Source: Based on Arturo & Díaz (2021)
3. Methodology
The methodology, framed in the quantitative paradigm and relational type of research, seeks to characterize specific behaviors of the current reality of the case study: industrial, commercial and service SMEs in the city of Pasto, with an analytical empirical approach and privileging, as a criterion of validity, the use of data from the experience of the owners, administrators and/or area managers of these organizations.
The instrument is submitted to content validity, based on the bibliographic review, with which widely recognized models are identified and characterized, establishing the correspondence between research objectives and indicators, seeking congruence and quality. Subsequently, the expert's review and pertinent adjustments were made; with this, a pilot test was applied to 52 businessmen to finally measure the consistency through Cronbach's Alpha, showing a high reliability of 0.84 for the instrument.
Small and medium-sized industrial, commercial and service enterprises (SMEs) in the city of Pasto were analyzed as the unit of study, comprising 514 establishments according to data provided by the Chamber of Commerce (2021). Taking into account the non-probabilistic convenience sampling from the total population and using the random distribution formula (95% confidence level and 7% margin of error), a sample of 147 entrepreneurs was selected, distributed proportionally: 117 and 30 entrepreneurs of small and medium-sized companies, respectively.
To determine the entrepreneurial commitment and respond to the hypothesis posed by the researcher: "there are low levels of commitment on the part of the owners, entrepreneurs and/or area managers to the application of minimum or basic project management tools that allow the success of their projects". To respond to this hypothesis, statistical validation was proposed in three phases (Figure 2).
Figure 2
Statistical validation phases

The first phase involves assigning a numerical value (M) to each company, taking into account the basic factors incorporated in the triple constraint (scope, time and costs) and applicable to business projects in SMEs in the city of Pasto. Their balance makes possible the quality of management and reflects the level of commitment advanced by those who manage them.
Table 4 shows the attributes used to measure the value (M) of the SME projects considered relevant to the research process.:
Table 4
Factors and attributes of measurement keys M-value
|
Factor |
Key attributes |
|
Scope |
Formal document Product - results - deliverables Knowledge |
|
Time |
Timeline Project completion |
|
Cost |
Budget Materials - equipment - supplies |
|
Other |
Project risks Training plan Influence of the leader |
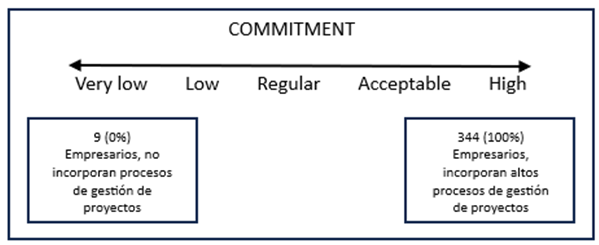
Once the ranges have been defined, for the researcher, the existence of very high entrepreneurial commitment to factors and attributes is present in those who reach as a result (M) levels ranging between 307 and 344 and very low commitment for those who reach scores between 9 and 77, as shown in the following figure:
Figure 3
Assessment of the level of commitment: project management factors
For the second phase, ten (10) validation scenarios are established that compare the level of business commitment with project management factors. Finally, phase three (hypothesis testing) starts with the formulation of specific hypotheses, defining ANOVA as the test statistic for each of the scenarios, and a significance level of 5%, after identifying the parametric behavior of the M values.
4. Results analysis
The results are presented below, through inferential analysis, which seeks to define business commitment in SMEs in the city of Pasto (Colombia), seeking to respond to the hypothesis: a project management methodology for SMEs in the city of Pasto (Colombia) will support the implementation of articulated strategies in the achievement of mission objectives. For this purpose, statistical validation was proposed in three phases, focused on the analysis of ten scenarios.
4.1 First phase, numerical value assignment M, commitment level
Actually, little has been done in small and medium-sized companies on the application of project management processes in SMEs. Most of those who manage projects in this type of organizations do not base their project management on the support of these tools, as was shown from the state of the art advanced by Arturo & Diaz (2021) and the existing gap of literature on the subject (project management) for the SME segment, scarcely treated worldwide (Rodriguez, 2018).
Commitment refers, in general terms, to the use made by entrepreneurs and/or SME managers of project management factors and attributes to achieve efficiency and proper management of scope, time and projected costs, or as stated by Lledó and Rivarola (2007) the 'triple project constraint' where: every project must have: 1) clarity regarding its scope (requirements to be satisfied), 2) time required and 3) budget (human talent, tools, financial resources), to achieve project success.
According to the results of the study, the level of commitment in the SMEs of the city of Pasto is high, corresponding to only 0.68%, that is, one of the companies analyzed reaches the higher M interval, as a result of the use of various project management tools. Very significant percentages show regular commitments (43.54%); low (10.20%) and very low (7.48%). The 38.10% of the respondents have rated themselves with acceptable commitments, which shows the application of some project management tools, however, there are aspects to improve in order to move from empiricism to the formalization of a project management methodology.
The Results allow inferring and show similarities with approaches by Mazurkiewicz1(2018), who emphasizes that, although small and medium-sized companies apply some project management procedures and reuse templates, these to improve their knowledge must innovate and make continuous improvements; with Saghati, McQueen, Dillon, & Wang (2017) who point to project management as a critical success factor in large and small companies and with the study of Zuzek, Gosar, Kusar and Berlec (2020) who conclude that the implementation of some project management practices, in small companies, generate positive impact on project success at the level of efficiency and stakeholder satisfaction.
Table 6
Evaluation of commitment in SMEs Pasto
|
Compliance Rating |
Interval M-value |
Number of companies |
Porcentage |
|
Very low commitment |
31 - 77 |
11 |
7.48 |
|
Low commitment |
78 – 123 |
15 |
10.20 |
|
Regular commitment |
123 - 214 |
64 |
43.54 |
|
Acceptable commitment |
215 – 306 |
56 |
38.10 |
|
High commitment |
307 – 344 |
1 |
0.68 |
|
Total |
- |
147 |
100 |
In this regard, the document Project Management for Development Organizations (PM4DEV, 2018) points out: on the one hand, that many organizations believe they have a good project management system; however, few can provide evidence of the use of a formal, consistent and reliable methodology; on the other hand, faith is placed in the technical skills of project managers, who, for the most part, have little or no formal training.
4.2 Second stage, validation scenarios
This phase establishes scenarios that compare the level of business commitment with project management factors advanced in the SMEs under study. Based on the responses of the applied instrument, Table 7 presents ten validation scenarios, directly related to project management and two, based on characterization elements and proposed subgroups (Yes - No - Partially), which allow creating scenarios to determine the degree of commitment to project management.
Table 7
Proposed scenarios
|
No |
Guiding questions: Project management |
Sub-groups |
||
|
1 |
Developed document formally authorizing the project; identified requirements that meet stakeholder needs and expectations |
Yes |
No |
Partial |
|
2 |
Formally defined timeline, prioritizes activities, times and responsible parties, allowing for follow-up and avoiding delays. |
Yes |
No |
Partial |
|
3 |
Defines products, results, documents or deliverables at the end of a process or activity. |
Yes |
No |
Patcial |
|
4 |
The organization prepared a detailed budget for the project. |
Yes |
No |
Partial |
|
5 |
Estimated the amount of materials, equipment or supplies required to execute each project activity |
Yes |
No |
Partial |
|
6 |
Identified, planned and monitored possible risks that the project team may face in the development of the project. |
Yes |
No |
Partial |
|
7 |
The project was completed and complies with the required characteristics. |
Yes |
No |
Partial |
|
8 |
The organization has developed a training plan for the team in charge of executing the project. |
Yes |
No |
Partial |
|
9 |
The project leader has a positive influence during all phases of the project. |
Yes |
No |
Partial |
|
10 |
The project leader has knowledge that facilitates the achievement of the goals and objectives outlined in the planning. |
Yes |
No |
Partial |
|
|
Guiding questions: Characterization elements |
|
|
|
|
11 |
Indicate the number of permanent employees the company has. |
Open aption |
||
|
12 |
How many years the company has been in operation |
Open option |
||
4.3 Third stage, hypothesis testing
The third phase proposes, based on the proposed scenarios (phase 2), the formulation of specific hypotheses. For this purpose, taking into account the comparison of three unrelated quantitative subgroups (with parametric distribution), the ANOVA test statistic is defined for each scenario with a significance level of 5%, and a comparison of means is made for the hypotheses proposed.
4.3.1 Scenario 1
|
Alternate Hypothesis |
Null Hypothesis |
|
There are differences between averages of SMEs that prepare, do not prepare or partially prepare a formal document as a project management tool. ) |
There are no differences between averages of SMEs that prepare, do not prepare or partially prepare a formal document as a project management tool.
|
Table 8 shows, based on Student's T, the descriptive behavior of data in general, identifying that of the scenario of companies that formally define their projects in a document, each subset is composed of 70 for those organizations that take into account the formal document as a project management tool; 52 for companies that do not take it into account and 25 for those that carry out the process partially. It is also possible to identify that the average M value of the companies that formally define their projects equals 245; those that do not define it reach an average of 122 and those that partially perform it reach an average of 188; results that seen in the light of Project Manager, more than half of the analyzed companies do not conceive the documentation of a project as one of the pillars of success to happily execute the proposed objectives.
The p-value, for the first scenario, is 0.000 lower than the established significance level (0.05), therefore the null hypothesis is rejected, finding statistically significant evidence of the existing difference between the means of the SMEs that prepare, do not prepare or partially prepare a formal document as a project management tool
Table 8
Student's t-test for Groups, scenario 1
|
M-value |
N |
Mean |
Deviation |
L. Lower |
Upper L. |
p-value |
|
1 |
70 |
245,13 |
39.086 |
235.81 |
254.45 |
0.000 |
|
2 |
52 |
122,73 |
51.222 |
108.47 |
136.99 |
|
|
3 |
25 |
188,68 |
32.022 |
175.46 |
201.90 |
|
|
Total |
147 |
192,23 |
69.794 |
180.85 |
203.61 |
1 Yes, it does; 2 No, it does not; 3 Partially it does; 1 Yes, it does; 2 No, it does not; 3 Partially it does
4.3.2 Scenario 2
|
Alternate Hypothesis |
Null Hypothesis |
|
There are differences between averages of SMEs that formally define a schedule, do not define it or partially define it in their project management process. . |
There are no differences between averages of SMEs that formally define a schedule, do not define it or partially define it in their project management process.
|
Table 9 shows, based on Student's T test, the descriptive behavior of the data in general. 47 companies formally define the schedule in their projects; 48 do not design it and 52 use it partially. The mean M-value of the companies that formally define the schedule in their project management process is 257, compared to the mean of 123 of those who do not use this tool and 196 use it partially. Despite being a simple and accessible control and monitoring tool that prioritizes activities, times and responsible parties, only 31% of entrepreneurs make use of it; in this regard, PMBOK (2017) considers that such process provides knowledge about the health of the project. An aspect that differs with what was found by White and Forune (2002) who state that Gantt charts are the most used aids in SME companies.
The p-value, for this scenario, is 0.000 lower than the significance level (0.05), rejecting the null hypothesis that allows finding statistically significant evidence of the existing difference between the means of the SMEs that formally define a schedule, do not define or partially define a schedule in their project management process.
Table 9
Student's t-test for Groups, scenario 2
|
M-value |
N |
Mean |
Deviation |
L. Lower |
Upper L. |
p-value |
|
1 |
47 |
257,04 |
35.553 |
246.60 |
267.48 |
0.000 |
|
2 |
48 |
123.85 |
51.484 |
108.90 |
138.80 |
|
|
3 |
52 |
196,77 |
45.494 |
184.10 |
209.43 |
|
|
Total |
147 |
192,23 |
69.794 |
180.85 |
203.61 |
1 Yes, it does; 2 No, it does not; 3 Partially it does; 1 Yes, it does; 2 No, it does not; 3 Partially it does
4.3.3 Scenario 3
|
Alternate Hypothesis |
Null Hypothesis |
|
There are differences between averages of SMEs that define, do not define or partially define products or deliverables as a project management tool.
|
There are no differences between averages of SMEs that define, do not define or partially define products or deliverables as a project management tool.
|
Table 10 shows the descriptive behavior of the data. 46 companies define products or deliverables; 40 do not, and 61 do so only partially. The mean M-value is 255, compared to those who do not define (116) and those who partially define (194), making it difficult to control, monitor and achieve the objectives.
The p-value is less than the significance level (0.000), finding statistically significant evidence of the difference between the means of SMEs that define, do not define or partially define products or deliverables as a project management tool.
Table 10
Student's t-test for Groups, scenario 3
|
M-value |
N |
Mean |
Deviation |
L. Lower |
Upper L. |
p-value |
|
1 |
46 |
255,17 |
38.535 |
243.73 |
266.62 |
0.000 |
|
2 |
40 |
116.50 |
59.491 |
97.47 |
135.53 |
|
|
3 |
61 |
194,43 |
39.664 |
184.27 |
204.58 |
|
|
Total |
147 |
192,23 |
69.794 |
180.85 |
203.61 |
1 Yes define; 2 No define; 3 Partially define; 1 Yes define; 2 No define; 3 Partially define
4.3.4 Scenario 4
|
Alternate Hypothesis |
Null Hypothesis |
|
There are differences between the average number of SMEs that prepare a detailed budget for the project, do not prepare a detailed budget or do so only partially as a project management tool. ) |
There are no differences between averages of SMEs that prepare a detailed budget for the project, do not prepare or partially prepare it as a project management tool.
|
Table 11 makes it possible to highlight, from Student's T, the descriptive behavior of data in a general way. In 29 companies the detailed budget is drawn up, 34 do not, and 84 of them do it partially. 263 is the average M value of companies with a detailed budget; 105 do not, and 202 of those with a partial budget.
As for the p value, for the quarter it is from 0,000 less to 0.05 (level of significance) rejecting the null hypothesis, therefore, there is statistically significant evidence of the difference between the averages of SMEs that draw up the detailed budget for their projects, do not draw up it or perform it partially as a project management tool.
Table 11
Student T Test for Groups, Stage 4
|
M-value |
N |
Mean |
Deviation |
L. Lower |
Upper L. |
p-value |
|
1 |
29 |
263,62 |
39.694 |
248.52 |
278.78 |
0.000 |
|
2 |
34 |
105.82 |
54.954 |
86.65 |
125.00 |
|
|
3 |
84 |
202,56 |
43.465 |
193.13 |
221.99 |
|
|
Total |
147 |
192,23 |
69.794 |
180.85 |
203.61 |
1 If prepared; 2 Do not elaborate; 3 Partially prepared
4.3.5 Scenario 5
|
Alternate Hypothesis |
Null Hypothesis |
|
There are differences between average SMEs that estimate the amount of materials, equipment or supplies to execute each project activity; they do not estimate it or perform it partially as a project management tool ) |
There are no differences between average SMEs that estimate the amount of materials, equipment or supplies to execute each project activity; they do not estimate it or perform it partially as a project management tool / |
Table 12 shows, starting with Student's T, the descriptive behavior of data in general, 31 estimates the amount of materials, equipment or supplies to execute each project activity; 30 do not define and 86 do partially. The average M value of the companies they define equals 258; 105 and 198, respectively, of organizations that do not or partially do so.
As for the p value, for the fifth scenario, this is 0,000, less than 0.05 (established level of significance), so the null hypothesis is rejected by finding statistically significant evidence of the difference between averages of SMEs that estimate materials, equipment or supplies to execute each project activity; they do not estimate or are partially carried out as a project management tool.
Table 12
Student T Test for Groups, Scenario 5
|
M-value |
N |
Mean |
Deviation |
L. Lower |
Upper L. |
p-value |
|
1 |
31 |
258,32 |
40.807 |
243.35 |
273.29 |
0.000 |
|
2 |
30 |
105.87 |
61.837 |
82.78 |
128.96 |
|
|
3 |
86 |
198,53 |
46.998 |
188.46 |
208.61 |
|
|
Total |
147 |
192,23 |
69.794 |
180.85 |
203.61 |
1 If prepared; 2 Do not elaborate; 3 Partially prepared
4.3.6 Scenario 6
|
Alternate Hypothesis |
Null Hypothesis |
|
There are differences between average SMEs that identify, plan and monitor potential risks; they do not identify or partially identify it as a management tool ) |
There are no differences between average SMEs that identify, plan and monitor potential risks; they do not identify or partially identify it as a management tool
|
Table 13 shows, starting with Student's T, the descriptive behavior of data in general. 44 companies have identified, planned and monitored potential risks of the project; 54 do not, and 49 claim to implement it partially. The M value for companies that identify, plan and monitor risks averages 247; those that do not or partially do not, averages 139 and 201, respectively.
The sixth scenario reaches a p value of 0,000, lower than the established level of significance (0.05), finding statistically significant evidence of the difference between the averages of SMEs that identify, plan and monitor potential risks, do not identify or partially identify them as a project management tool.
Table 13
Student T Test for Groups, Stage 6
|
M-value |
N |
Mean |
Deviation |
L. Lower |
Upper L. |
p-value |
|
1 |
44 |
247,27 |
43.587 |
234.02 |
260.52 |
0.000 |
|
2 |
54 |
139.13 |
68.343 |
120.48 |
157.78 |
|
|
3 |
49 |
201,33 |
43.857 |
188.73 |
213.92 |
|
|
Total |
147 |
192,23 |
69.794 |
180.85 |
203.61 |
1 If prepared; 2 Do not elaborate; 3 Partially prepared
4.3.7 Scenario 7
|
Alternate Hypothesis |
Null Hypothesis |
|
There are differences between the average number of SMEs that complete the project, do not complete or partially complete the management process |
There are no differences between average SMEs completing the project, not completing or partially completing their management process |
Table 14 shows the descriptive behavior of the data, identifying that the subgroup of companies that complete projects is 39, compared with 24 that do not complete and 84 that perform partially. It is possible to identify that the average M value of companies finalizing projects is equivalent to 263; for those who do not finalize 96 and those that do partially, it equals 186. Concerns are raised: only 26 per cent finish their projects, 16 per cent partially and 58 per cent do not finish them. A trend that coincides with the Gartner report (cited Ardila 2015), 20% of projects finish and the Chaos (2015) and Chaos (2020) reports, which claim 29% and 31%, respectively, are successful, showing high failure rates, which do not improve over time.
This scenario presents a p value of 0,000, less than the level of significance (0.05), accepting the alternate hypothesis, which shows statistically significant evidence of the difference between averages of SMEs that finish a project, do not finish it or perform partly in its management process.
Table 14
Student T Test for Groups, Scenario 7
|
M-value |
N |
Mean |
Deviation |
L. Lower |
Upper L. |
p-value |
|
1 |
39 |
263,36 |
35.833 |
251.74 |
274.97 |
0.000 |
|
2 |
24 |
96,08 |
56.327 |
72.30 |
119.87 |
|
|
3 |
84 |
186,68 |
44.944 |
176.93 |
196.43 |
|
|
Total |
147 |
192,23 |
69.794 |
180.85 |
203.61 |
1 If prepared; 2 Do not elaborate; 3 Partially prepared
4.3.8 Scenario 8
|
Alternate Hypothesis |
Null Hypothesis |
|
There are differences between average SMEs that draw up a training plan for their workforce, do not carry out it or do it partially in their project management processs
|
There are no differences between average SMEs that develop training plans for their workforce, do not carry out them or do so partially in their project management process . |
Table 15 shows, from Student's T, the descriptive behavior of data, 27 companies are considering a training plan for their work team; 71 of them do not, and 49 do partially. The average M value of companies that define a training plan is 274, compared to those that do not define it (151) and 205 do it partially.
Considering that the training plan focuses on knowledge, skills and competencies to develop a project efficiently, the low interest in training is worrying; authors such as Gray and Larson (2009) consider it key in project management to develop high-performance teams; Leal Paredes (2020), for their part, emphasizes the need to incorporate soft competencies as a basis for the success of such management.
The p value, for this scenario, is 0,000 below the level of significance, finding statistically significant evidence of the difference between the average SMEs that draw up training plan, do not carry out it or are partly done, in their project management process.
Table 15
Student T Test for Groups, Scene 8
|
M-value |
N |
Mean |
Deviation |
L. Lower |
Upper L. |
p-value |
|
1 |
27 |
274,74 |
27.266 |
263.95 |
285.53 |
0.000 |
|
2 |
71 |
151.65 |
63.181 |
136.69 |
166.60 |
|
|
3 |
49 |
205,57 |
46.315 |
192.27 |
218.87 |
|
|
Total |
147 |
192,23 |
69.794 |
180.85 |
203.61 |
1 If prepared; 2 Do not elaborate; 3 Partially prepared
4.3.9 Scenario 9
|
Alternate Hypothesis |
Null Hypothesis |
|
There are differences between average SMEs in which the leader influences positively during all phases of the project, does not do so or performs partially in their project management process ) |
There are no differences between average SMEs in which the leader influences positively during all phases of the project, does not do so or perform partly in their project management process
|
Table 16 shows, from Student's T, the descriptive behavior, 58 of the companies analyzed consider that the leader influences positively in all phases; 16 of them, consider there is no positive influence, and 73 say it acts partially. The average M value of the companies (252) consider the positive influence of the leader in each of its phases; 62 and 173, respectively, consider there is no influence or this is partial.
As for the p value, for the ninth scenario, it is 0,000 less than the level of significance, so the null hypothesis is rejected, finding statistically significant evidence of the difference between the average SMEs in which the leader positively influences during all phases of the project, does not do so or is partially carried out.
Table 16
Student T Test for Groups, Scene 9
|
M-value |
N |
Mean |
Deviation |
L. Lower |
Upper L. |
p-value |
|
1 |
58 |
252,21 |
39.960 |
241.70 |
262.71 |
0.000 |
|
2 |
16 |
62.31 |
31.485 |
45.54 |
79.09 |
|
|
3 |
73 |
173.05 |
37.225 |
164.37 |
181.74 |
|
|
Total |
147 |
192,23 |
69.794 |
180.85 |
203.61 |
1 If prepared; 2 Do not elaborate; 3 Partially prepared
4.3.10 Scenario 10
|
Alternate Hypothesis |
Null Hypothesis |
|
There are differences between SMEs averages in which the project leader has knowledge that facilitates the achievement of proposed objectives, has no knowledge or these are partial ) |
There are no differences between average SMEs in which the project leader has knowledge that facilitates the achievement of proposed objectives, has no knowledge or these are partial
|
Table 17 shows, starting with Student's T, the descriptive behavior of the data. 58 companies consider their leader's knowledge to be adequate, 17 lack knowledge and 72 their knowledge is partial. The average M value, in companies that consider their leader to have knowledge, is 251; compared with averages of 64 and 174, for those who lack adequate knowledge or are partial.
The p value, for the tenth scenario, is 0,000 less than the level of significance, therefore, the null hypothesis is rejected, finding statistically significant evidence of the difference between the averages of SMEs in which the project leader has knowledge that facilitates the achievement of the proposed objectives, does not have them or these are partial.
Table 17
Student T Test for Groups, Scenario 10
|
M-value |
N |
Mean |
Deviation |
L. Lower |
Upper L. |
p-value |
|
1 |
58 |
251,52 |
40.567 |
240.85 |
262.18 |
0.000 |
|
2 |
17 |
64.59 |
31.896 |
48.19 |
80.99 |
|
|
3 |
72 |
174,61 |
37.136 |
165.88 |
183.34 |
|
|
Total |
147 |
192,23 |
69.794 |
180.85 |
203.61 |
1 If prepared; 2 Do not elaborate; 3 Partially prepared
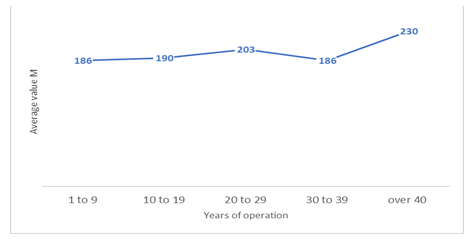
On the other hand, it was noted, as an interesting finding, that the experience of companies (measured in years of operation) and size (measuring in number of employees), are not factors that are related to the level of commitment of companies to the planning, organization, direction and control of the three basic elements of project management: scope, time and costs.
Figure 4 shows the average years of operation compared to the use of project management tools. It identifies how, over the years of operation, no different behaviors are visualized in the use of these tools, presenting similar levels in their M value, ranging between 186 and 230
Figure 4
Average M Value by years of operation
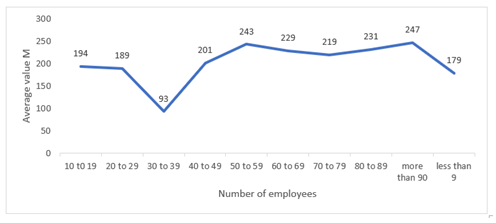
For its part, Figure 5 shows that the average, according to the number of employees,ins similar ranges (201 to 247), except for the range of 30 to 39 years, without this signifying a proportional ratio to the use of management tools.
Figure 5
Average M Value by Number of Employees
5 Final considerations
The scenarios contrasted by statistical inference: (elaborating a formal document, finalising the project, formally defining the timetable, defining products, results, documents or deliverables, taking into account a training plan, highlighting the influence of the project leader, demonstrating the knowledge of the Project Leader, establishing a detailed budget for the development of a project, estimating the amount of materials, equipment or supplies required in each activity and for the project and identifying, planning and monitoring the risks of the project) are significant for SMEs, however the study concludes the implementation of some processes by a limited number of companies, which in some way generate impact, which coincides with what O’Loughlin and Peláez (2019), a project can be considered successful, if it adheres to the scope, schedule, budget, achievement of objectives and customer satisfaction.
For its part, Ocaña (2015) points out the need for organizations to adapt continuously to new and changing market situations that make the environment global, demanding and competitive; therefore, a good project management allows to respond to that environment.
Taking into account the basic factors incorporated by the research as part of the triple restriction (reach, time and cost), none of the 10 analyzed scenarios are applied by more than 50% of the companies under study. The highest implementation percentages are in the first scenario (formal documentation) applied by 47% of respondents; ninth scenary (leader influence) noted by 39% of the cases analyzed and tenth scenario, on which 39.5 of the target population consider the project leader has knowledge to guide the management of the projects. The other scenarios present representative statistics ranging from 68% to 81%.
The above makes it possible to validate the hypothesis proposed in the research: “there are low levels of commitment by the owners, entrepreneurs and/or heads of area towards their basic project management processes”, which does not favour the implementation of articulated strategies in the achievement of missionary objectives efficiently, that is, ensuring the success of the project, eliminating obstacles and inspiring the team to perform each activity with quality.
References
Amat, J. M. (2007). Control de Gestión: Una perspectiva de Dirección. España (6.a ed.). Ediciones Gestión 2000.
Ardila, I. (2015). Las diez predicciones digitales para 2015 según Gartner. Obtenido de http://www.revistapym.com.co/destacados/las-10-predicciones-digitales-2015-seg-n-gartner chrome-extension://efaidnbmnnnibpcajpcglclefindmkaj/https://www.standish group.com/sample_research_files/CHAOSReport2015-Final.pdf
Arturo-Delgado, B., Díaz-Piraquive, F.N. (2021). Project Management in Small and Medium Enterprises to Improve Management Knowledge. In: Uden, L., Ting, IH., Wang, K. (eds) Knowledge Management in Organizations. KMO 2021. Communications in Computer and Information Science, vol 1438. Springer, Cham. https://doi.org/10.1007/978-3-030-81635-3_17
Cámara de Comercio de Pasto. (2021). Boletín Estadístico 2020, Movimiento del Registro Público. boletín-Disponible en https://ccpasto.org.co/wp-content/uploads/2022/06/BOLETIN-ESTADISTICO-2020.pdf.
Ceballos Gómez, H. F. (2022). Financial risk in colombian health sector entities. TECHNO REVIEW. International Technology, Science and Society Review /Revista Internacional De Tecnología, Ciencia Y Sociedad, 11(3), 1–9. https://doi.org/10.37467/revtechno.v11.4450
Daccach, J. (2018). Formulación y Gerencia de proyectos. Obtenido de https://www.deltaasesores.com/formulacion-y-gerencia-de-proyectos/
De Heredia, R. (2007). Dirección integrada de proyecto (DIP): Project Management (2.a ed.). ETS Ingenieros.
Díaz, M.L. (2015). Pyme de avanzada: Motor del desarrollo en América Latina. Editorial Universidad de Los Andes.
Gray, C. F., & Larson, E. W. (2009). Gerenciamento de projetos. AMGH Editora.
ISO. GTC-ISO 21500. Directrices para la dirección y gestión de proyectos. Obtenido de https://tienda.icontec.org/gp-directrices-para-la-direccion-y-gestion-de-proyectos-gtc-iso21500-2013.html
Leal Paredes, M.S. (2020). Competencias blandas en los gerentes de proyecto de las organizaciones participantes del programa doctoral DBA de Centrum Católica (Ecuador). Revista Científica RES NON VERBA, 10(1).
Lledó, P. y Rivarola, G. (2007). Gestión de Proyectos: cómo dirigir proyectos exitosos, coordinar los recursos humanos y administrar los riesgos. Prentice Hall – Pearson Education
Mazurkiewicz, I. The Management of projects in the small and medium-sized enterprise from an epistemological perspective (2018) Rev. Negotium, 14 (40), pp. 64-76. Obtenido de http://search.ebscohost.com.ezproxy.umng.edu.co/login.aspx?direct=true&db=asn& AN=132376825&site=ehost-live
Moncayo, C. (2017). Las pymes son la verdadera locomotora económica colombiana. https://incp.org.co/las-pymes-la-verdadera-locomotora-economica-colombiana/
Ocaña, J.A. (2015). Gestión de proyectos con mapas mentales. Vol. I. Editorial Club Universitario San Vicente Alicante.
Okpara, JO y Wynn, P. (2007). Determinantes de las restricciones al crecimiento de las pequeñas empresas en una economía del África subsahariana. Revista de gestión avanzada SAM, 72 (2), 24.
Office of Government Commerce (OGC). (2009). Managing Successful Projects with PRINCE2. The Stationary Office.
PM4DEV. (2018). Project Management for Development Organizations. Obtenido de https://www.pm4dev.com
Project Management Institute (PMI). (2013). Guía de los fundamentos para la dirección de proyectos. Guía del PMBOK (5.a ed.). Project Management Institute, Inc.
Project Management Institute (PMI). (2017). Guía de los fundamentos para la dirección de proyectos. Guía del PMBOK (6.a ed.). Project Management Institute, Inc. 60
Project Management Institute (PMI). (2021). Guía de los fundamentos para la dirección de proyectos. Guía del PMBOK (7.a ed.). Project Management Institute, Inc.
Project Success failed 19% Quick Reference Card Based on CHAOS 2020: Beyond Infinity Overview. January’2021, QRC by Henny Portman chrome-extension://efaidnbmnnnibpcajpcglclefindmkaj/https://hennyportman.files.wordpress.com/2021/01/project-success-qrc-standish-group-chaos-report-2020.pdf
Rodríguez Rey, J. C. (2018). Characterization of Northwestern Argentinian Construction SMEs according to their performance in Project Management. Universidad Nacional de Tucumán. Facultad de Ciencias Exactas y Tecnología. Centro de Investigación, Desarrollo e Innovación Industrial
Saghati, H., McQueen, R., Dillon, S., & Wang, W. (2017). A critical hermeneutics analysis of SME ERP implementation project management practices. Paper presented at the Proceedings of the 28th Australasian Conference on Information Systems, ACIS 2017, Retrieved from www.scopus.com
Standish Group International. (2015). The Chaos Report 2015. Chrome extension. https://www.standishgroup.com/sample_research_files/CHAOSReport2015-Final.pdf
Indicadores claves para evaluar y controlar proyectos, segunda edición Toro López Francisco J (2020). Segunda edición. Bogotá Colombia. ISBN 978-792-958—792-136-6. Ediciones de la U https://books.google.com.co/books?id=BeEZEAAAQBAJ&printsec=frontcover&hl=es&source=gbs_ge_summary_r&cad=0#v=onepage&q&f=false
Vega, R.A., Castaño, A. y Mora, Á.J. (2011). Pymes: Reflexiones para la pequeña y mediana empresa en Colombia. Editorial Politécnico Grancolombiano.
White, D., & Fortune, J. (2002). Current practice in project management - an empirical study. International Journal of Project Management, 20(1), 1-11. doi:10.1016/S0263-7863(00)00029-6
Žužek, T., Gosar, Ž., Kušar, J., & Berlec, T. (2020). Adopting agile project management practices in non-software SMEs: A case study of a slovenian medium-sized manufacturing company. Sustainability (Switzerland), 12(21), 1-17. doi:10.3390/su12219245
-----
i Doutorando em Projectos, Universidad Internacional Iberoamericana. Mestre em Gestão de Empresas. Especialista em Finanças, Universidad Libre de Cali; Especialista em Docência Universitária; Economista, Universidad de Nariño. Professor investigador, Grupo de Investigação Contar, Universidade de Mariana, Pasto, Nariño.
ii Titulação: Doutor em Administração, Mestre em Gestão Empresarial Especialista em Finanças e Especialista em Gestão Financeira, Pesquisador Associado e Diretor de Estudos de Pós-Graduação da Universidade Mariana, Colômbia.