Influência de fatores contingenciais no nível de governança
pública dos municípios do estado do Paraná
Influence of contingent factors on the level of public governance of municipalities in the
state of Paraná
Danilo Rabito1i, Orcid: https://orcid.org/0000-0003-1330-8840; Romildo de Oliveira Moraes2ii, Orcid: https://orcid.org/0000-0003-0498-9437
1. Câmara Municipal de Arapongas, Arapongas, Paraná, Brasil. E-mail: danilohfr@gmail.com 2. Universidade Estadual de Maringá (UEM), Programa de Pós-graduação em Ciências Contábeis - PCO/UEM, Maringá, Paraná, Brasil. E-mail: romoraes@uem.br
Resumo Este estudo explora as características da Governança Pública Municipal, referente ao Índice de Governança Municipal (2021) elaborado pelo Conselho Federal de Administração. Foram coletadas informações dos 399 municípios do estado do Paraná, em um total de 18 variáveis explicativas (variáveis independentes) utilizadas na correlação e nos modelos de regressão linear múltipla. Para fins deste estudo foram considerados como fator contingencial externo o ambiente e como fatores contingenciais internos estrutura, porte, cultura, tecnologia e estratégia. Os resultados demonstram que o fator contingencial externo ambiente e os fatores contingenciais internos estrutura e porte influenciam o nível de governança pública municipal. A regressão linear múltipla demonstrou que as variáveis selecionadas explicam a governança pública municipal em 46,70%, e o estudo demonstrou que princípios importantes presentes na literatura sobre governança pública, como transparência, accountability e eficácia não foram estatisticamente significativos para o modelo de regressão linear múltipla.
Palavras-chave: Teoria da Contingência; Governança Pública; Índices.
Abstract This study explores the characteristics of Municipal Public Governance, relating to the Municipal Governance Index (2021) drawn up by the Federal Council of Administration. Information was collected from the 399 municipalities in the state of Paraná, with a total of 18 explanatory (independent) variables used in the correlation and multiple linear regression models. For the purposes of this study, the external contingency factor was the environment and the internal contingency factors were structure, size, culture, technology, and strategy. The results show that the external contingency factor environment and the internal contingency factors structure and size influence the level of municipal public governance. The multiple linear regression showed that the selected variables explain 46.70% of municipal public governance, and the study showed that important principles mentioned in the literature on public governance, such as transparency, accountability, and effectiveness, were not statistically significant for the multiple linear regression model.
Keywords: Contingency Theory, Public Governance; Indexes.
Reference: Rabito, D., & Moraes, R. O. (2025). Influência de fatores contingenciais no nível de governança pública dos municípios do estado do Paraná. Gestão & Regionalidade, v. 41, e20259105. https//doi.org/10.13037/gr.vol41.e20259105
1 Introduction
In 1340, nine elected executive magistrates of the Republic of Siena, in Italy, entered the Sala dei Nove (Hall of the Nine) inside the Palazzo Pubblico (seat of the republic) to make the necessary decisions and were inspired by the surrounding frescoes – paintings on a ceiling or wall – by Ambrogio Lorenzetti called the Allegories of good and bad government (c.1337- 1340) (Skinner, 1999), with examples of the results that the city could achieve with good or bad governance, planting the seeds of concern and a sense of accountability in the minds of the magistrates of Siena, given that internal contingency factors, i.e., their decisions, would affect the lives of the population. They were also faced with the existence of external factors, such as the Black Death that ended up decimating the population of Siena in 1348. Leaving the Middle Ages behind and entering modern times, concern no longer stems from paintings on walls, but rather from bright screens, such as those of computers or cell phones, and also from potential extreme weather events and, why not, new pandemics.
However, what is the relevance of public governance in the core of the public sector? According to Dias and Cairo (2014), governance is presented as a blanket term, with countless consensuses and behaviors, broken down into corporate governance and public governance. The harmony of power between citizens, elected representatives, senior management, managers and employees, always aiming to have the common good favored over the interests of individuals or groups, can be understood as a system of public governance (Matias-Pereira, 2010).
The fundamental principle of the Contingency Theory is the enhancement of performance and effectiveness through harmony between environment and structure (Brignall & Modell, 2000). Hence the Contingency Theory provides researchers with the challenge of determining elements that bring about contingency factors in the organizational environment (Fiirst & Beuren, 2021), making it possible to produce surveys covering organizational and behavioral aspects since the 1970s (Otley, 1980).
Therefore, the Municipal Government Index (MGI) drawn up by the Brazilian Federal Council of Administration (FCA) will be used for the scope of this article, with the intention of answering the following survey question: What is the influence of contingency factors on the Public Governance Assessment Index in the municipalities of the state of Paraná?
According to Buta and Teixeira (2020), there is a lack of practical, empirically validated and interconnected assessment metrics, supported by public governance concepts, to systematically verify public action. This survey aims to help strengthen the debate on the influence of contingency factors on public governance, giving the results an empirical cast.
2 Theoretical Framework
2.1 Contingency Theory
Efficiency, performance and organizational behavior are inclined to be instigated by contingency factors (Brignall & Modell, 2000; Greenwood & Hinings, 1976; Theisman & Klijn, 2008). Technology, structure, strategy, organizational size, organizational culture and leadership are characterized by the literature as internal contingency factors. When we talk about external contingency factors, the emphasis is on the environment (Beuren & Fiorentin, 2014; Fagundes et al., 2010; Gonzaga et al., 2016; Greenwood & Hinings, 1976; Wadongo & Abdel-Kader, 2014; Woods, 2009; Oliveira & Callado, 2018; Sell, Beuren & Lavarda, 2020). This factor is important due to its uncertainty, because of its influences it has on internal
contingency factors and because it is less well controlled by organizations (Wadongo & Abdel- Kader, 2014).
One of the main theoretical lenses when considering the study of organizations is contingency factors, since they influence the relationship between attributes and performance (Donaldson, 2001). Nevertheless, according to Sell et al. (2020) the literature to date has not established a specific model of contingency factors that influence organizations. However, when the purpose is to investigate public policies, factors of different natures and determinations intervene in organizations (Höfling, 2001), and in order to achieve the desired repercussions, the involvement of contingency factors is necessary (Porporato, 2011).
According to Prajogo (2016), the development of some organizations leans towards the environmental conditions in which they find themselves and that they face. Therefore, improving performance in one’s environment is essential to achieving organizational stability (Cadez & Guilding, 2008; Covaleski, Evans, Luft & Shields, 2003). For this reason, there is a consensus in the literature that the environment is one of the external contingency factors.
Taking the Brazilian context into consideration, several studies have already made reference to internal contingency factors, oriented in accordance with the Contingency Theory perspective, such as: mechanistic and organic organizational structure (Fagundes et al., 2010); technology, structure, strategy and organizational size (Beuren & Fiorentin, 2014); management practices (Gonzaga et al., 2016); size, strategy, structure, technology, culture and organizational leadership (Oliveira & Callado, 2018); leadership, structure and organizational size (Sell et al., 2020), and technology, structure and organizational size (Fiirst & Beuren, 2021).
Several surveys have already been carried out in the context of performance appraisals in the Brazilian public sector, a proposition present in public governance concepts, verifying the external and internal factors that are capable of influencing municipal performance, such as the amount of Municipal Property Tax (Portuguese acronym IPTU) collected (Avellaneda & Gomes, 2015; Avellaneda & Gomes, 2017); the Municipal Human Development Index (MHDI) (Sell et al., 2020) and the Firjan Municipal Development Index (FMDI) (Fiirst & Beuren, 2021).
2.2 Public Governance
At first, governance was focused on conflicts faced by private organizations, especially after the major financial scandals that befell North American companies (Aquino, Silva, Vasconcelos & Castelo, 2021; Borges & Serrão, 2005). Accordingly, the term governance has been advocated in some studies geared towards the private sector, entitled corporate governance (Cavalcante & Luca, 2013). Corporate governance also gained relevance in the 1990s after accounting scandals in publicly traded corporations and large privately owned banks (Oliveira & Pisa, 2015).
The concept of governance is polysemic, multidimensional and replete with uncertainties (Graaf & Asperen, 2018; Rhodes, 2007; Rose-Ackerman, 2017). This means that the purpose of public governance encompasses broad and undefined concepts, which is also the case with its principles (Buta & Teixeira, 2020). Accordingly, the existence of the term, in the private or public sector, is the topic of numerous discussions, but the term governance was already in use in ancient times, as demonstrated in the introduction, mainly in city-states, where authorities from aristocratic families were chosen to govern, which was simply the public sector of the time (Graaf & Asperen, 2018). There is no exclusive definition of public governance; however, there are different starting points designed for a new structuring of relations between
the state and its organizations at the federal, state and municipal levels (Andrews, 2008; Fukuyama, 2013; Grindle, 2010; Matias-Pereira, 2010).
The citizen as a participant in the preparation and implementation of public policies is a crucial point in public governance (Castro & Silva, 2017). The state must manifest its various influences, but it must not forget to coordinate lines of cooperation with civil society and the market (Ronconi, 2011). Good public governance is institutionalized through accountability and the transparency of public acts. It is essential to implement new forms of interaction and dialog between the principles of social control and participatory management (Ceneviva & Farah, 2012).
Measurement is a significant topic in the literature on public governance (Hallerberg & Kayser, 2013; Andrews, Hay & Myers, 2010). In order to develop an indicator that is respected in terms of public governance, it is necessary to glean an in-depth knowledge of its concept, which as we have seen is not an easy task; to explore the importance of concretizing these concepts in order to mitigate failures in the institutionalization of public policies and to investigate which contingency factors influence the development of an indicator.
2.2.1 Indicators
The execution of indicators to estimate public governance is not new, since several international organizations and scientific articles (Aquino et al., 2021; Mello & Slomski, 2010; Oliveira & Pisa, 2015; Yong & Wenhao, 2012) have already presented indicators on the subject.
Some opposing opinions are raised in the literature regarding public governance indices at a national level, i.e. which takes into account the data of one nation and compare it with another, which is detrimental to the analysis of nations with high levels of inequality, such as Brazil. It can be identified that they do not appreciate reality and specificities, because the comparison between several countries is made in a generic and abstract manner (Van de Walle, 2005), or because of the aggregation of large amounts of data from numerous sources, abbreviated to a single number (Oman & Arndt, 2010). Public governance indicators, at the national level, are too basic to provide a complete picture and drive the necessary reforms, and are not capable of answering key governance questions (Farrington, 2010; Gisselquist, 2014; Yong & Wenhao, 2012).
2.2.2 Municipal Governance Index (MGI)
This study uses the MGI (2021), conceived by the FCA, an indicator that qualifies Brazilian municipalities. It is therefore a municipal-level metric that draws on three dimensions (Finance, Management and Performance), and thus aims to demonstrate significant changes at the subnational level, i.e. the municipal level (Harttgen & Klasen, 2012). The data used to calculate the MGI are listed in Table 1. The MGI has been used by the FCA since 2017, and the data collected correspond to two previous years, i.e. the 2020 MGI uses data from 2018, while the 2021 MGI uses data from 2019, and so on, and presents data from the 399 municipalities in the state of Paraná, unlike other indices.
Table 1 – Municipal Governance Index (MGI)
| Local Revenue minus administrative structure |
| Autonomy Higher-better |
| divided by Current Net Revenue |
| Investments Investments divided by Total Revenue Higher-better |
| Fiscal |
| Cash minus Accrued Liabilities divided by |
| Liquidity Higher-better |
| Current Net Revenue |
| Personnel Personnel Expenditure divided by Current Net |
| Higher-better |
| Expenditure Revenue* |
| The amount of health expenditure (expenses |
| per Health expenditure |
| committed to the health account) divided by Higher-better |
| per capita |
| the population |
| capita |
| Investment Education The amount of education expenditure |
| Finance |
| expenditure per (expenses committed to the education account) Higher-better |
| capita divided by the population |
| the |
| Legislative branch Legislative spending (expenses committed to |
| of |
| Legislative Branch expenditure per the legislative account) divided by the Lower-better |
| Cost capita population |
| Security |
| Social security Score obtained by the SSSI according to the |
| Balance Higher-better |
| status indicator criteria of the methodology |
| Social |
| Amount of unprocessed accrued liabilities |
| (UALs) (budgeted expenses in the overall total |
| Expenditure of expenses with registration of UALs) divided |
| Lower-better |
| planning by the municipality's total expenditure |
| (budgeted expenses in the overall total of |
| committed expenses) |
| Planning |
| Amount of funds raised through agreements |
| (1.7.6.0.00.00.00 - Transfers of Agreements) |
| Fundraising Higher-better |
| divided by the municipality's total current |
| revenue |
| General MPE** Arithmetic mean of the scores obtained in the |
| Higher-better |
| Law subitems of the general law |
| Management Government |
| Total number of employees in direct |
| employees per Lower-better |
| administration, divided by the population |
| capita |
| Employees |
| Total number of appointed officials without an |
| Appointed officials employee relationship in direct administration, Lower-better |
| divided by the total number of employees |
| Availability of Amount of information available divided by |
| Higher-better |
| Information the total number of databases |
| Number of outstanding CAUC related issues |
| Transparency CAUC*** Lower-better |
| in relation to the total number of items |
| Checklist applied by the Federal Public |
| Transparency Prosecutor's Office (Portuguese acronym MPF) Higher-better |
| to the municipalities |
| Number of deaths among residents under one |
| year of age divided by the total number of live |
| Infant mortality Lower-better |
| births to resident mothers and, finally, |
| multiplied by one thousand |
| Health Population covered by the Family Health and |
| Primary care |
| Primary Care teams divided by the total Higher-better |
| coverage |
| population |
| Vaccination Population coverage of all vaccination |
| Higher-better |
| coverage campaigns (the immunization category is used) |
| Ratio between the number of dropouts and |
| total enrollments for the year, multiplied by |
| School dropouts Lower-better |
| 100 at rural and urban municipal public |
| schools |
| IDEB**** 5th |
| Result of the public school network for the |
| year of primary Higher-better |
| initial years in the IDEB |
| school |
| Result of the public school network for the |
| IDEB**** grade 9 Higher-better |
| Education final years in the IDEB |
| Proportion of students in the initial years of |
| Age-grade elementary school more than 2 years behind |
| Lower-better |
| distortion rate their peers in rural and urban municipal public |
| schools |
| Performance |
| The rate of coverage rate at nursery schools is |
| Child Daycare calculated by the ratio between the number of |
| Higher-better |
| Coverage enrolments and the population corresponding |
| to the 0-3 age group. |
| Number of incidents (CID10 [X85-Y09 and |
| Homicide Rate Y35-Y36]) divided by the population Lower-better |
| multiplied by 100,000 |
| Safety |
| Number of incidents (CID10 [CID-BR- |
| Road Traffic |
| 10:104]) divided by the population multiplied Lower-better |
| Deaths |
| by 100,000 |
| Population with water service divided by the |
| Access to water Higher-better |
| total population (IN055) |
| and |
| Access to |
| Population with wastewater service divided by |
| Environment wastewater Higher-better |
| the total population (IN056) |
| Sanitation collection |
| Wastewater Ratio of treated wastewater to water consumed |
| Higher-better |
| treatment (IN046/SNIS) |
| Number of people registered in the CAD Único |
| Social |
| Social Vulnerability (Unified Registry for Social Programs) divided Lower-better |
| vulnerability |
| by the population of the municipality |
| Note: * the data extracted from the Firjan Fiscal Management Index (FFMI) is presented as it was published by |
| Firjan. Therefore, the data obtained in the Calculation Method was processed in such a way as to allow its |
| presentation in the form of an index ranging from 0 to 1. This index is always presented in the “Higher-better” |
| polarity. For example, it is known that the lower the personnel expenditure, the better it is for the municipality, but |
| the index provided by Firjan has already made the necessary adjustments for the index to have “Higher-better” |
| polarity. ** MPE (Micro and Small Enterprise). *** CAUC (Tax Requirement Information System). **** IDEB |
| (Portuguese acronym for National Education Quality Index). |
| Source: MGI (2021). |
3 Methodology
The core purpose of the survey is to represent the peculiarities of certain populations or facts, making use of uniform data gathering techniques (Gil, 2008). The survey therefore qualifies as descriptive in correlation to its objective. It is the type of survey that explores the comprehension and understanding of reality in most depth, by explaining the reason things happen (Scarpin & Slomski, 2007).
The behavior of the first stage of the article is predominantly documental, supported by bibliographic research. In turn, the second stage has a predominantly quantitative, descriptive aspect, as it seeks to verify the influence of contingency factors with regard to the municipal public governance assessment index (MGI), applying the empirical-analytical research method, which combines the use of treatment and analysis of the indicator with quantitative metrics.
The data used in the survey were structured in Microsoft Excel® spreadsheets and SPSS Statistics Version 2.0 was used to conduct the normality, correlation and multiple linear regression tests. According to Martins and Domingues (2011, p. 595) “prior analysis of the correlation between variables makes it possible to identify any variables that will not help the regression analysis produce good results.”
The survey applied multiple linear regression to distinguish the contingency factors that influence the level of public governance of municipalities in the state of Paraná, 399 municipalities in total, using the Ordinary Least Squares (OLS) method. According to Fávero and Belfiore (2021), the OLS method has some assumptions that must be taken into account when performing multiple linear regression: normal distribution of the residuals; no high correlation between the explanatory variables (multicollinearity problem); having more observations (in this study there were 399) than explanatory variables (the study has 18); residuals not correlated with any explanatory variable (heteroscedasticity problem) and being random and independent (autocorrelation problem).
Two regression models were used, one with 16 variables that obtained statistical significance of 1% (p <0.01) in the correlation. The enter method was employed and the stepwise procedure was applied to the last model with six variables that obtained statistical significance of 1% (p <0.01), 5% (p < 0.05) and 10% (p < 0.10) in the first regression model. According to Hair, Black, Babin, Anderson and Tatham (2009), a general rule for the sample size in a multiple linear regression is that it must never fall below five observations for an independent variable, yet the expected level is from 15 to 20 observations for each independent variable, which makes it possible to universalize the results. The authors point out that, if the stepwise procedure is employed, the recommended level becomes 50 to 1. This information is relevant to the parameters applied in the survey.
The Durbin-Watson test was used to check for autocorrelation; the Variance Inflation Factor (VIF) test was used to check for multicollinearity; the Breusch-Pagan/Cook-Weisberg test (BP/CW test) and the White test were used to check for heteroscedasticity in the residuals; and the Kolmogorov-Smirnov and Shapiro-Wilk tests were used to check for normal distribution of the residuals.
The data collected corresponds to 2019, since the MGI 2021 methodology uses data from that year. The survey is cross-sectional, i.e. it uses data to describe a single time-point (Hair et al., 2009). The multiple linear regression model is applied when the intention is to add more than one independent variable in the regression model (Martins & Domingues, 2011).
3.1 Survey Variables
The survey contains two classes of variables: (1) dependent variable; (2) independent variables – these are the internal and external contingency factors of the municipalities – in line with the Contingency Theory. Table 2 presents these variables with pertinent references from previous studies.
Table 2 – Survey Variables
| Variables Measure Reference |
| Dependent Variable |
| Municipal |
| Public Municipal Governance Index – (MGI) (FCA) Rabito, Sanches, Carvalho and Paiva (2022) |
| Governance |
| Independent Variables |
| Rabito et al. (2022); Santos and Rover |
| Municipal Human Development Index (MHDI) |
| (2019); Sell et al. (2020); Vieira (2009) |
| Ipardes Municipal Performance Index (IMPI) Survey authors |
| Fiirst, Baldissera, Martins and Nascimento |
| Environment Firjan Municipal Development Index (FMDI) |
| (2018); Fiirst and Beuren (2021) |
| Macedo and Corbari (2009); Fiirst et al. |
| Degree of Dependence Indicator (DDI) |
| (2018) |
| Gross Domestic Product (GDP) Fiirst and Beuren (2021) |
| Social Observatory (SO) Fiirst and Beuren (2021) |
| Avellaneda and Gomes (2015); Rabito et al. |
| Indicator of Net Personnel Expenses (INPE) |
| (2022); Sell et al. (2020) |
| Structure |
| Macedo and Corbari (2009); Fiirst et al. |
| Capital Structure (CS) |
| (2018) |
| Avellaneda and Gomes (2015); Fiirst and |
| Population Log (POPLG) Beuren (2021); Rabito et al. (2022); Sell et |
| al. (2020) |
| Size Avellaneda and Gomes (2015); Sell et al. |
| Population Density (POPDENS) |
| (2020) |
| Collected Revenue Log (CRLG) Fiirst and Beuren (2021) |
| Public Sector Size (PSS) Vieira (2009) |
| Rabito et al. (2022); Santos and Rover |
| Participation in the 2016 Elections (PARTELE) |
| (2019) |
| Culture |
| Public Administration Transparency Index |
| Survey authors |
| (PATI) |
| Budgeted Revenue Realization Indicator |
| Fiirst et al. (2018); Fiirst and Beuren (2021) |
| (BRRI) |
| Technology |
| Current Budget Execution Indicator (CBEI) Fiirst et al. (2018); Fiirst and Beuren (2021) |
| Adjusted Current Net Revenue per capita |
| Sell et al. (2020) |
| (CNRpc) |
| Strategy |
| Avellaneda and Gomes (2015); Avellaneda |
| IPTU collected per capita (IPTUpc) |
| and Gomes (2017) |
| Note: the formulas and data source of the variables can be found in Figure 1. |
| Source: compiled by the authors. |
3.2 Survey Hypotheses
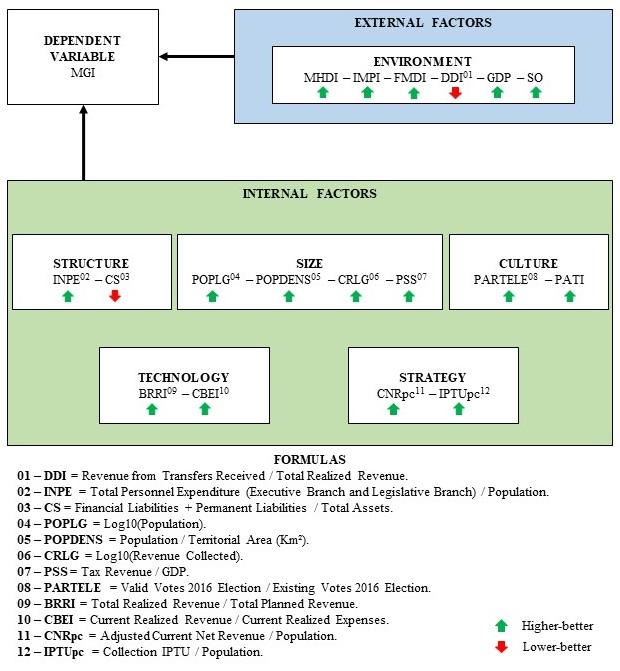
Independent variables constitute external and internal factors, as established by the Contingency Theory. For the external contingency factor environment, we used the MHDI, IMPI, FMDI, DDI, GDP and the presence or absence of SOs in the municipalities. The latter is a dichotomous variable, commonly referred to as a dummy variable, with a response not equal to 0 (zero) but rather to 1 (one).
Maximizing the well-being of its citizens is one of society's greatest interests and, consequently, one of the main incentives for managers to make intelligent use of public resources (Scarpin & Slomski, 2007; Silva, Kuwahara & Maciel, 2012). Social development is not only correlated to the topic of income or economic growth; its meaning lies in humans, observing their capacities and what opportunities can be provided by the state (Silva, Silva, Souza & Silva, 2015). It is one of the factors closely interconnected with good governance (Graaf & Asperen, 2018).
Hypothesis 1 – The external contingency factor environment positively influences the level of public governance of municipalities in the state of Paraná.
Structure, size, culture, technology and strategy were established as internal factors. Starting with structure, the independent variable INPE is intended to determine how much the municipality spends on Executive and Legislative Branch personnel per capita, using the formula personnel expenses and charges (Executive Branch and Legislative Branch) divided by the population. The higher the INPE, the better the execution of processes, given the high level of payment to government employees, thus contributing with more qualified and motivated staff to carry out activities (Chenhall, 2003).
Sell et al. (2020) showed that the level of performance of municipalities in the state of Santa Catarina was influenced by this variable, i.e. the higher the personnel expenditure, the better the municipal performance. The use of this variable counterpoints the association of performance being correlated with lower personnel expenditure in relation to Current Net Revenue (CNR), used in other studies investigating the influence of transparency (Fiirst et al., 2018), indebtedness (Macedo & Corbari, 2009) and performance (Fiirst & Beuren, 2021). This facilitates the inclusion of the variable in the regression model, since the other calculation methodology (personnel costs / CNR) is used by the MGI.
The independent variable CS determines how much third-party capital is allocated to fund the organization's commitments, therefore the variable's calculation formula is equivalent to financial liabilities plus permanent liabilities divided by the municipality's total assets, and the higher the value of CS, the greater the municipality's propensity to indebtedness (Macedo & Corbari, 2009), a situation that impairs its ability to enable investments and contribute to economic growth and quality of life (Cavalcante, 2016). Therefore, it is expected that the lower the indebtedness, the higher the level of municipal public governance.
Hypothesis 2 – The internal contingency factor structure positively influences the level of public governance of municipalities in the state of Paraná.
With regard to the internal factors, the size factor was classified into four independent variables: POPLG, POPDENS, CRLG and PSS. The first variable, POPLG, assesses whether population size influences the municipal public governance relationship, since municipalities with larger populations are portrayed as environments that generate specialized jobs that require
a qualified workforce which are therefore more perceptive about the relevance of their political participation and the efficient use of public resources to provide positive externalities for society (Shapiro, 2006).
The same understanding applies to the second variable, POPDENS, since as the result of the public policies executed affects a greater number of people, strategic development is required (Scarpin & Slomski, 2007; Sell et al., 2020; Varela, 2008). Thus, the greater the population grouping, the better the level of municipal public governance.
The third variable, CRLG, the natural logarithm of total revenue collected, suggests that the higher the revenue collected, the greater the freedom of resources to hire and train good government employees to implement policies that help the municipality develop good public governance. Financial aptitude is associated with the collection of taxes, and greater economic dynamism leads to better ability to collect revenue (Mendes, Ferreira, Abrantes & Faria, 2018).
Finally, the PSS measures the municipality's tax revenue divided by GDP, and the higher the PSS, the greater the influence of tax revenue on economic activity and, therefore, the greater the municipality's dependence on public sector activity. The public sector is expected to seek measures to enhance its social utility attribution, enabling quality of life and well-being (Vieira, 2009). It is believed that the higher the PSS, the greater the public governance, since the public sector is extremely important to the municipality's economy, and if it is in financial straits, this will affect the quality of life of its citizens to a considerable extent.
Hypothesis 3 – The internal contingency factor organizational size positively influences the level of public governance of municipalities in the state of Paraná.
When considering the internal contingency factor culture, we suggest the variable PARTELE, which examines the number of votes cast in 2016, i.e. voters with valid electoral cards eligible to participate in the electoral process that year divided by the valid votes, i.e. the votes cast for a particular candidate who was running for electoral office; consequently, blank and null votes were excluded from the count of valid votes, in accordance with the regulation applied by the Superior Electoral Court (Portuguese acronym TSE). Involvement in elections through voting confirms the effect of belonging, of the voter's integration into his or her society, favoring the recognition of institutions (Lavalle & Vera, 2011). Voting is the mechanism that citizens use to express their interests, goals and beliefs (Cavalcante, 2016).
The independent variable PATI, created in 2019 by the Paraná State Court of Auditors (Portuguese acronym TCE-PR), provides its own methodology for measuring transparency in the Executive Branch of municipalities in Paraná. It is believed that the higher the PATI, the higher the level of public governance. The drawback of this variable is its scope, as it is exclusive to the state of Paraná, but it is an alternative to the Transparency Index of the Federal Public Prosecutor's Office (2016), the National Transparency Ranking, which is used in the MGI, but which was last published in 2016.
According to Beuren and Söthe (2009), transparency minimizes the political cost and supports the reintegration of the acceptability of public acts. Less information about public policies in place favors retrospective voting, in other words, continuing to vote for the same manager (Cavalcante, 2016). The better the transparency, the better the efficiency in the use of resources in the education and health sectors, thus achieving better well-being for the population (Cruz, Ferreira, Silva & Macedo, 2012). Other studies of the public sector discuss the importance of the internal contingency factor culture (Cruz, Silva & Santos, 2009; Cucciniello, Porumbescu & Grimmelikhuijsen, 2017; Fox, 2007).
Hypothesis 4 – The internal contingency factor organizational culture positively influences the level of public governance of municipalities in the state of Paraná.
The internal factor technology imposes two independent variables on the study: BRRI and CBEI. Internal budgeting processes are equivalent to the procedural flow of activities, and are therefore committed to the technology factor (Fiirst & Beuren, 2021). The BRRI calculation model uses total realized revenue divided by total budgeted revenue. This showcases the degree of success achieved in the revenue planning undertaken by the municipality's technical staff. It is expected that the higher the BRRI, the higher the level of public governance. The outcomes perceived through the budget favor an understanding of sensitive points in the implementation of public policies and pave the way for adjustments that are essential for their better development (Pace, Basso & Silva, 2003).
As regards the CBEI, its calculation consists of current realized revenue divided by current realized expenses, thus the variable does not take into consideration the total budget, because it does not include capital expenses and revenue in the account, but only the capacity to keep the “administrative machine” running, given that current expenses are the basic outlay for services and public policies to take place, without extraordinary stoppages, so as not to have a negative impact on the population. Therefore, the higher the CBEI, the higher the level of public governance. The ability of the administration to maximize its revenues and minimize its expenses is established as public spending efficiency (Chan & Karim, 2012).
Hypothesis 5 – The internal contingency factor technology positively influences the level of public governance of municipalities in the state of Paraná.
Finally, the internal contingency factor strategy consists of two independent variables: CNRpc and IPTUpc. The first variable, CNRpc, applies the formula Adjusted CNR divided by the population. The higher the CNRpc, the higher the level of public governance, since the municipality has more capital per person to use in public programs and policies that will favor the optimization of good public governance. The variable was applied as a measure of municipal performance, since the organization of revenue collection and the administration's ability to execute these resources will result in positive externalities for the local population (Sell et al., 2020).
The independent variable IPTUpc examines the amount of IPTU collected divided by the population. IPTU is a tax that is often ignored by municipalities and applied for electioneering purposes with the unmistakable phrase “I will not be increasing the IPTU,” but the mayor, or mayoral candidate, disregards the inflation factor, which erodes the power of money over time, and does not make the readjustment, an attitude that does not aspire to fiscal balance, but rather to electoral ascension or the candidate's non-reproval in the election (Cavalcante, 2016). Therefore, it is expected that the higher the IPTUpc, the higher the level of public governance, considering public administration's commitment to fiscal accountability.
The variables CNRpc and IPTUpc help to mitigate concern over the investigation of fiscal policy related to municipalities' own revenue collection, which is not given due importance in some studies (Cavalcante, 2016).
Hypothesis 6 – The internal contingency factor strategy positively influences the level of public governance of municipalities in the state of Paraná.
Figure 1 – Survey Hypotheses
Note: MGI data was collected on the Internet portal of the index, conceived by the Federal Council of Administration (FCA). MHDI data was collected on the Internet portal of the Atlas of Human Development in Brazil, conceived by the United Nations Development Program (UNDP). IMPI data was collected from the portal of the Institute of Economic and Social Development of the State of Paraná (Portuguese acronym IPARDES). FMDI data was collected from the portal of the Federation of Industries of the State of Rio de Janeiro (Portuguese acronym Firjan). DDI, INPE, CS, CRLG, PSS, BRRI, CBEI, CNRpc and IPTUpc data was collected from the Brazilian Public Sector Accounting and Tax Information System (Portuguese acronym SICONFI) portal, conceived by the National Treasury Secretariat (Portuguese acronym STN) and from the Municipal Information System - Monthly Monitoring (Portuguese acronym SIM-AM) portal, conceived by the Paraná State Court of Auditors (Portuguese acronym TCE-PR). GDP, POPLG and POPDENS data was collected from the Brazilian Institute of Geography and Statistics (Portuguese acronym IBGE) portal. SO data was collected from the Social Observatory of Brazil (Portuguese acronym OSB) and TCE-PR portals. PARTELE data was collected from the
electronic portal of the Superior Electoral Court (Portuguese acronym TSE). PATI data was collected from the TCE-PR portal. Source: compiled by the authors.
4 Results
The MGI is a synthetic index with a score from 0 to 10 involving three dimensions (Finance, Management and Performance) with the aim of supporting public managers through results, possible opportunities to improve municipal public governance and the way in which good practices improve the lives of citizens (MGI, 2021). For analysis purposes, the municipalities were divided according to their score, between very high (above 8 points), high (above 7 to 7.99), medium (above 6 to 6.99), low (above 5 to 5.99) and very low (above 0 to 4.99), the same scale of results used by Oliveira and Pisa (2015) in preparing the Public Governance Assessment Index (PGovI).
The municipality of Curitiba, the state capital, obtained the highest score in the index (8.18), followed by Francisco Beltrão (8.06) and Palmeira (7.81). Taking into account the worst scores, we encounter the municipality of Santa Inês (2.40), followed by Ariranha do Ivaí (2.53) and Arapuã (2.67). The mean was 5.38, while the standard deviation was 1.10. Of the 399 municipalities studied, 2 (0.50%) showed a very high level of municipal public governance, followed by 30 (7.52%) with a high level, 88 (22.06%) with a medium level, 126 (31.58%) with a low level and 153 (38.34%) with a very low level. Figure 2 provides an overview of the scores obtained by the municipalities in Paraná.
The dependent variable MGI showed normality in the data collected in the literature review, with a normality test with significance of 0.200 (Kolmogorov-Smirnov) and 0.122 (Shapiro-Wilk). Pearson's correlation was applied due to this result.
To carry out the correlation, we used all the independent variables as presented in Table 2, totaling 18 variables. Of these, 17 variables correlated at a statistical significance level of 1% (p < 0.01) or 5% (p < 0.05) in relation to the dependent variable MGI: MHDI (0.240), IMPI (0.210), FMDI (0.277), DDI (-0.493), GDP (0.238), SO (0.300), INPE (-0.508), CS (0.248), POPLG (0.612), POPDENS (0.215), CRLG (0.579), PSS (0.219), PARTELE (-0.111), PATI (0.137), CBEI (0.157), CNRpc (-0.412) and IPTUpc (0.244). It should be noted that the only variable that was not statistically significant (0.086) was the BRRI, as shown in Table 3.
Figure 2 – Overview of the MGI Score
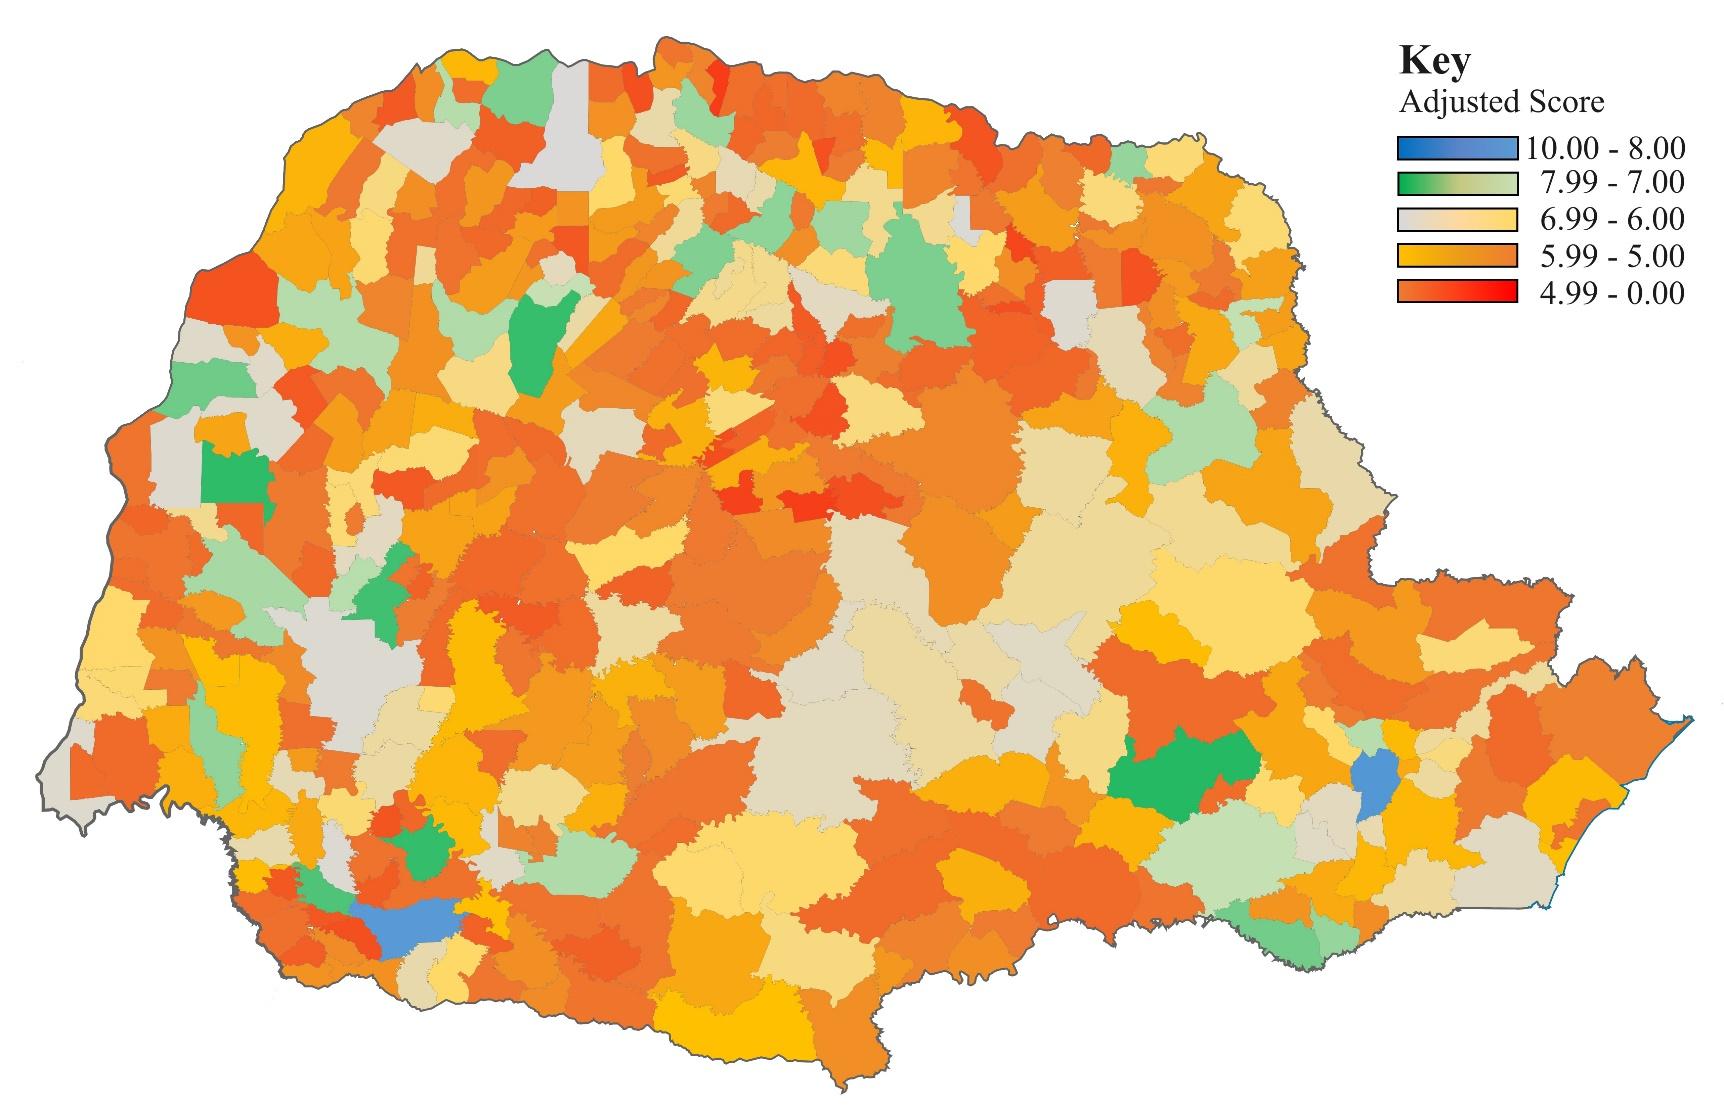
Source: compiled by the authors.
Table 3 – Pearson’s Correlation Matrix of the Dependent Variable MGI
| Variables MGI MHDI IMPI FMDI DDI GDP SO INPE CS POPLG POPDENS CR |
| MGI 1 |
| MHDI 0.240** 1 |
| IMPI 0.210** 0.664** 1 |
| FMDI 0.277** 0.646** 0.630** 1 |
| DDI -0.493** -0.461** -0.270** -0.437** 1 |
| GDP 0.238** 0.300** 0.244** 0.255** -0.377** 1 |
| SO 0.300** 0.381** 0.286** 0.424** -0.478** 0.419** 1 |
| INPE -0.508** 0.020 0.144** -0.028 0.289** -0.105* -0.210** 1 |
| CS 0.248** 0.037 0.017 0.055 -0.228** 0.068 0.090 -0.088 1 |
| POPLG 0.612** 0.333** 0.187** 0.381** -0.719** 0.509** 0.609** -0.657** 0.139** 1 |
| POPDENS 0.215** 0.261** 0.171** 0.211** -0.367** 0.834** 0.241** -0.145** 0.063 0.460** 1 |
| CRLG 0.579** 0.419** 0.295** 0.460** -0.798** 0.579** 0.655** -0.452** 0.134** 0.962** 0.502** 1 |
| PSS 0.219** 0.250** -0.017 0.177** -0.580** 0.214** 0.302** -0.134** 0.169** 0.402** 0.266** 0.43 |
| PARTELE -0.111* -0.020 0.054 -0.030 0.219** -0.072 -0.105* 0.192** -0.050 -0.237** -0.063 -0.21 |
| PATI 0.137** 0.138** 0.152** 0.179** -0.165** 0.094 0.166** -0.088 -0.143** 0.206** 0.087 0.22 |
| BRRI 0.086 -0.023 0.035 0.024 -0.172** 0.020 -0.030 -0.018 -0.049 0.059 0.032 0.10 |
| CBEI 0.157** -0.027 -0.009 0.024 -0.310** 0.051 0.063 -0.007 0.101* 0.129** 0.090 0.18 |
| CNRpc -0.412** 0.078 0.192** 0.010 0.137** -0.074 -0.175** 0.936** -0.062 -0.574** -0.110* -0.35 |
| IPTUpc 0.244** 0.431** 0.176** 0.346** -0.580** 0.288** 0.369** -0.075 0.125* 0.431** 0.299** 0.48 |
| Note: ** significance at the 0.01 level; * significance at the 0.05 level. |
| Source: compiled by the authors. |
After completing the correlation, the 16 independent variables that achieved statistical significance of 1% (p < 0.01) were used to run the first multiple linear regression model. The first model was found to be statistically significant at the level of 0.000, with an adjusted R² of 0.462. This means that the variables in the model predict 46.20% of the municipal public governance level achieved by the municipality in the MGI.
The model did not present an autocorrelation problem, with a Durbin-Watson value of 1.861, which is higher than 1 and lower than 3 (Field, 2020). It did not present a multicollinearity problem, according to the VIF test (4.134 < 10), which indicates an increase in the variance of a regression coefficient (Fávero & Belfiore, 2021). The sample size of the first model was 25:1 (16 variables with 399 observations), above the desirable threshold, which is between 15 and 20 (Hair et al., 2009), and because of this we used the enter method in the multiple linear regression.
Only six variables were statistically significant at the levels of 1% (p < 0.01), 5% (p < 0.05) or 10% (p < 0.10) in this first multiple linear regression model: INPE (0.000), CS (0.000), CRLG (0.003), IMPI (0.016), SO (0.030) and POPLG (0.055). The data from the first model can be seen in Table 4, along with coefficients, standard error (SE) and other information.
Table 4 – Multiple Linear Regression MGI – First Model
| ANALYSIS OF ASSUMPTIONS |
| Durbin- Nº |
| Prob > F Adjusted R² VIF BP/CW Test White Test |
| Watson Observations |
| 0.000 0.462 1.861 4.134 0.621 0.195 399 |
| ANALYSES OF INDEPENDENT VARIABLES |
| Independent Random |
| Variables Coefficient SE T p-value 95% CI |
| MHDI 0.196 1.680 0.117 0.907 -3.107 3.500 |
| IMPI 2.746 1.131 2.427 0.016** 0.522 4.970 |
| FMDI 0.120 1.029 0.117 0.907 -1.902 2.143 |
| DDI 0.518 0.789 0.656 0.512 -1.034 2.070 |
| GDP -0.000 0.000 -0.375 0.708 -0.000 0.000 |
| SO -0.436 0.200 -2.179 0.030** -0.830 -0.043 |
| INPE -0.001 0.000 -4.495 0.000*** -0.001 -0.001 |
| CS 0.464 0.104 4.464 0.000*** 0.259 0.668 |
| POPLG -1.792 0.931 -1.924 0.055* -3.623 0.039 |
| POPDENS -0.000 0.000 -0.847 0.398 -0.001 0.000 |
| CRLG 3.114 1.053 2.956 0.003*** 1.043 5.185 |
| PSS -2.613 10.755 -0.243 0.808 -23.759 18.533 |
| PATI 0.153 0.380 0.403 0.687 -0.594 0.900 |
| CBEI 0.500 0.391 1.280 0.201 -0.268 1.269 |
| CNRpc 0.000 0.000 0.552 0.581 -0.000 0.000 |
| IPTUpc 0.000 0.001 0.460 0.646 -0.001 0.002 |
| CONS -12.889 4.797 -2.687 0.008*** -22.321 -3.458 |
| Note: *** significance at the level of 0.01; ** significance at the level of 0.05; * significance at the level of 0.10. |
| Source: compiled by the authors. |
Neither the Breusch-Pagan/Cook-Weisberg test (0.621) nor the White test (0.195) showed any heteroscedasticity problem. The data was therefore confirmed to be homoscedastic.
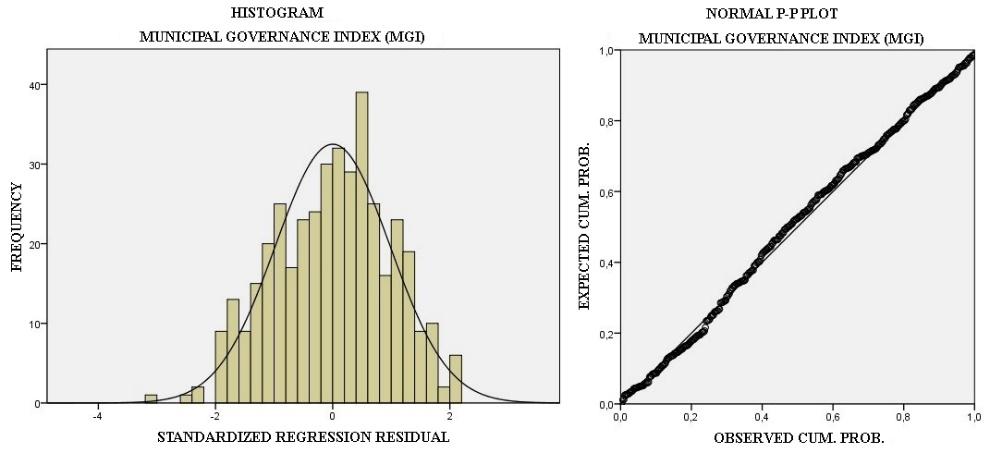
The residuals showed normality in the data with Kolmogorov-Smirnov (0.200), but did not show normality in the Shapiro-Wilk test (0.027), and the model showed two outliers (Londrina and Santo Antônio do Paraíso). Figure 3 presents the empirical tests graphically, with the Histogram and Normal P-P Plot, confirming the normality of the data.
Figure 3 – Histogram and Normal P-P Plot of the residuals of the First Model
Source: compiled by the authors.
Only the six variables with statistical significance of 1% (p < 0.01), 5% (p < 0.05) or 10% (p < 0.10) were used for the second model. This model is statistically significant at the level of 0.000, with an adjusted R² of 0.467, i.e. the variables in the model predict 46.70% of the level of municipal public governance. The sample size of the second model was 66:1 (six variables with 399 observations), within the desirable range, above 50 (Hair et al., 2009). Accordingly, the multiple linear regression used the stepwise procedure. The data for the second model can be found in Table 5.
Table 5 – Multiple Linear Regression MGI – Second Model
| ANALYSIS OF ASSUMPTIONS |
| Durbin- Nº |
| Prob > F Adjusted R² VIF BP/CW Test White Test |
| Watson Observations |
| 0.000 0.467 1.848 1.800 0.262 0.237 399 |
| ANALYSES OF INDEPENDENT VARIABLES |
| Independent Random |
| Variables Coefficient SE T p-value 95% CI |
| POPLG -1.957 0.744 -2.632 0.009*** -3.419 -0.495 |
| CS 0.452 0.098 4.600 0.000*** 0.259 0.645 |
| INPE -0.001 0.000 -5.887 0.000*** -0.001 -0.001 |
| CRLG 3.089 0.754 4.099 0.000*** 1.607 4.570 |
| IMPI 2.842 0.818 3.473 0.001*** 1.233 4.450 |
| SO -0.401 0.185 -2.163 0.031** -0.766 -0.037 |
| CONS -10.732 2.551 -4.207 0.000*** -15.748 -5.716 |
| Note: *** significance at the level of 0.01; ** significance at the level of 0.05. |
| Source: compiled by the authors. |
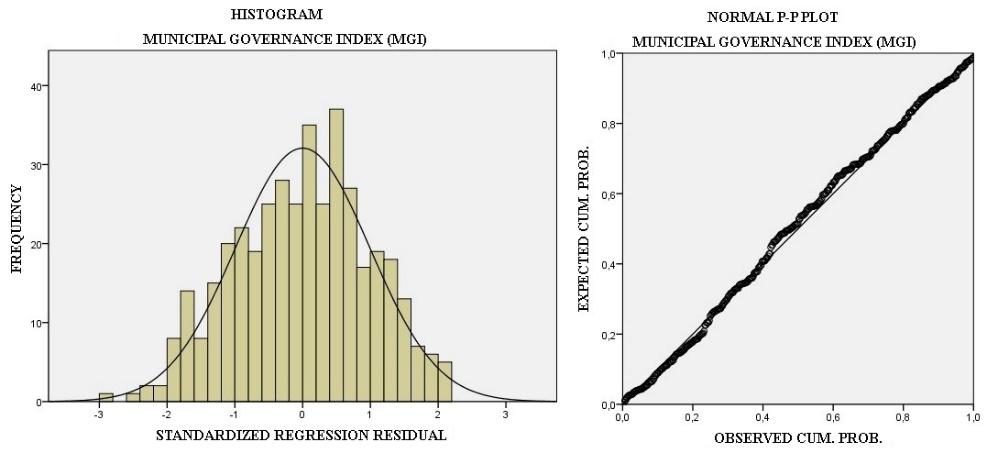
The normality of the residues can be seen in the Histogram and Normal P-P Plot, as shown in Figure 4.
Figure 4 – Histogram and Normal P-P Plot of the residuals of the Second Model
Source: compiled by the authors.
The model did not present an autocorrelation problem, with a Durbin-Watson value of 1.848, which is higher than 1 and lower than 3 (Field, 2020). No multicollinearity problem was detected with the VIF test (1.800 < 10), which indicates an increase in the variance of a regression coefficient (Fávero & Belfiore, 2021). Five of the variables were statistically significant at the level of 1% (p < 0.01) in this second multiple linear regression model: INPE (0.000), CS (0.000), CRLG (0.000), IMPI (0.001) and POPLG (0.009). The variable SO (0.031) was the only one to show statistical significance at 5% (p < 0.05).
Due to the existence of two outliers in the first model and three outliers in the second model, regression was carried out with the exclusion of these outliers to verify the impact. In the first model, the result with outliers was an adjusted R² of 0.462 and with the removal of the two outliers (Londrina and Santo Antônio do Paraíso) it was an adjusted R² of 0.457, a difference of 0.005. For the second model, the result with outliers was an adjusted R² of 0.467 and with the removal of the outliers (Curitiba and Alto Paraíso, the latter only appeared after the removal of the three originally mentioned) it was an adjusted R² of 0.448, a difference of 0.019. Considering the relative insignificance of the variation found and the importance of the municipalities that would be left out of the regression, we opted for the results with the presence of outliers.
5 Analysis of Results
With regard to the correlation performed, of the 17 variables with statistical significance, three stood out as their correlation differed from expectations. In other words, the variables CS, PARTELE and CNRpc showed a contradictory correlation in relation to the MGI. Consequently, the higher the municipality's indebtedness, the lower the participation in elections and the lower the municipality's revenue per inhabitant, the higher the municipalities' score in the index, negating the concepts of public governance in the literature in the area of efficiency, accountability, and effectiveness.
The opposite correlation regarding the variable INPE was already likely, given the more New Public Management (NPM) nature, which takes into account certain essential principles such as managerialism, disaggregation, incentives, decentralization, debureaucratization, competition and privatization (Farah, 2001; Freitas, Silva, Vicente, Rosa & Santos, 2022), applied in the index methodology. However, despite the contentious correlation, according to
Martins and Domingues (2011) the variables CS and PARTELE obtained a very poor correlation (between 0.0 and 0.4), and the variable CNRpc had a low correlation (between 0.40 and 0.6), i.e. they are significant, but do not contribute significantly to increasing the MGI score.
The correlation matrix, Table 3, also showed statistical significance between independent variables, which is worth noting. There was a moderate, significant, and positive correlation between the variable MHDI and the variables IMPI (0.664) and FMDI (0.646), which also occurred between the variables IMPI and FMDI (0.630). The variable SO also had a significant positive correlation with the variables POPLG (0.609) and CRLG (0.655). As for the moderate, significant, and negative correlation, we should emphasize the correlation of the variable DDI with the variables POPLG (-0.719) and CRLG (-0.798), which also occurred in the correlation of the variables INPE and POPLG (-0.657).
There was a strong, significant, and positive correlation between the variables GDP and POPDENS (0.834), INPE and CNRpc (0.936), POPLG and CRLG (0.962), and lastly, PSS and IPTUpc (0.831). All the contingency factors in the study (environment, structure, size, culture, technology, and strategy) showed a statistically significant correlation with the municipal public governance assessment index (MGI).
We can see that the execution of the two models involved the option of reducing variables that were not statistically significant, which was achieved, reducing the number of variables from 16 to just six. However, the variation in the forecast, i.e. the adjusted R², was not as successful, changing from 46.20% to 46.70%. The results of the MGI (2021) showed that the contingency factors: environment (IMPI and SO), structure (INPE and CS) and size (CRLG and POPLG) influence, with statistical significance of 1% (p < 0.01) or 5% (p < 0.05) the level of public governance of the municipalities in the state of Paraná, and the model generated by multiple linear regression produced an adjusted R² of 0.467. Nevertheless, it is worth noting that the variables INPE, SO and POPLG were statistically significant, but with a value contrary to expectations, thus contributing negatively to the index score. Nevertheless, the variables CS, IMPI and CRLG contributed positively to the index score, with the latter two having a considerable coefficient, (2.842) and (3.089) respectively, above the other variables in the same factor, hence it is possible to validate hypotheses 1, 2 and 3 of this survey, as presented in Table 6.
Table 6 – Decision for the Hypotheses Tested
| Hypotheses Proposed Relations MGI |
| H1 Contingency factor environment Confirmed |
| H2 Contingency factor structure Confirmed |
| H3 Contingency factor size Confirmed |
| H4 Contingency factor culture * |
| H5 Contingency factor technology * |
| H6 Contingency factor strategy * |
| Note: * not significant. |
| Source: compiled by the authors. |
The contingency factor environment was also statistically significant in other studies (Fiirst & Beuren, 2021; Rabito et al., 2022; Sell et al., 2020). However, the results show that the IMPI contributed positively, while the SO contributed negatively. In other words, the existence of a Social Observatory is not a favorable predictor of good municipal public governance in relation to the MGI, but it should be noted that the correlation between the variable SO and the MGI was very poor, but positive.
The internal contingency factor structure was statistically significant and influenced the index score. It can be seen that the negative effect of the variable INPE was not as high as initially imagined, being a predictor that negatively influences the index score, but to a negligible extent (-0.001), bearing in mind that the variable had a low and negative correlation (-0.508). This result differs from the findings of Fiirst and Beuren (2021), but corroborates the results of other studies (Rabito et al., 2022; Sell et al., 2020) referring to the contingency factor structure. We can confirm, due to the relevance of the variable CS, that the municipality's lack of indebtedness contributes to economic growth, quality of life (Cavalcante, 2016), and good municipal public governance.
As regards the contingency factor size, previous studies have shown that greater population grouping generates positive externalities (Rabito et al., 2022; Scarpin & Slomski, 2007; Sell et al., 2020; Varela, 2008), but the results show that good municipal public governance is not one of them, since the variable POPLG contributed negatively (-1.957). However, the variable's correlation was moderate and positive (0.612). It was also observed that the variables POPLG and CRLG had a strong and positive correlation (0.962), validating the fact that population growth leads to higher tax collection figures (Vieira, 2009).
6 Final Considerations
The construction of an index designed to measure the public governance of a municipality, given the conceptual complexity and differences of opinion among authors, represents an arduous task for its author. The indices can help reduce information asymmetry for society as a whole. The aim of this study is to empirically test the influence of contingency factors on the Public Governance Assessment Index in municipalities in the state of Paraná.
Therefore, the index methodology that divides education and health spending by the population, assigning a higher-better polarity (Table 1), may be biasing the results, and it would be better to assign an efficiency methodology that does not take into account the higher amount of money per person, but rather the efficiency of this application. Future studies could verify this uncertainty. However, the survey shows that greater economic dynamics afford better revenue-generating capacity (Mendes et al., 2018) as well as good public governance, given that the variable CRLG contributed positively and with significant value. Future studies could carry out a more in-depth analysis of the IMPI, considering that this index showed a significant coefficient in the multiple linear regression, verifying which subitem attributes a higher value to the MGI.
The study showed a discrepancy in the data in relation to the correlation and multiple linear regression in the internal contingency factor structure, specifically in the independent variable CS, where it was noted that the variable in the correlation had a positive value, i.e., the higher the indebtedness the higher the score in the MGI, but obtained statistical significance of 1% (p < 0.01) in predicting the index score in the multiple linear regression, emphasizing that the lower the indebtedness the better the municipality's governance. We should emphasize that the correlation of the CS also obtained statistical significance of 1% (p < 0.01), but showed a very poor correlation (between 0.0 and 0.4) (Martins & Domingues, 2011). The issue of indebtedness is a controversial topic in public governance, since there is a legal limit to indebtedness and being in debt does not constitute default, so this variable needs to be analyzed more closely in relation to the principles of good governance.
One of the aspects of the result that gives rise to lack of confidence is the internal contingency factor culture, where the principles of transparency and accountability are present, since the factor was not statistically significant at the levels of 1% (p < 0.01), 5% (p < 0.05) or
10% (p < 0.10) in any of the models. Therefore, new metrics should be developed in the index methodology in order to improve the perception of these principles in the index (MGI).
The internal contingency factors technology and strategy refer to the management of public bodies, and none of the variables in these factors were statistically significant in the regression models presented. It is therefore necessary to carry out further studies on these factors in relation to public governance, since with technology and a good strategy the municipality can achieve economic growth (Kormendi & Meguire, 1985) as a result of good municipal public governance.
References
Andrews, M. (2008). The Good Governance Agenda: Beyond Indicators without Theory.
Oxford Development Studies, 36(4), 379-407. https://doi.org/10.1080/13600810802455120
Andrews, M., Hay, R., & Myers, J. (2010). Can Governance Indicators Make Sense? Towards
a New Approach to Sector-Specific Measures of Governance. Oxford Development Studies, 38(4), 391-410. https://doi.org/10.1080/13600818.2010.524696
Aquino, C. V. M. G., Silva, C. R. M. da, Vasconcelos, L. R. S., & Castelo, J. L. (2021).
Governança Pública dos municípios brasileiros. Gestão & Regionalidade, 37(110), 203-220. https://doi.org/10.13037/gr.vol37n110.6542
Avellaneda, C. N., & Gomes, R. C. (2015). Is small beautiful? Testing the direct and nonlinear
effects of size on municipal performance. Public Administration Review, 75(1), 137-149. https://doi.org/10.1111/puar.12307
Avellaneda, C. N., & Gomes, R. C. (2017). Mayoral quality and municipal performance in
Brazilian local governments. Organizações & Sociedade, 24(83), 555-579. https://doi.org/10.1590/1984-9240831
Beuren, I. M., & Fiorentin, M. (2014). Influência de Fatores Contingenciais nos Atributos do
Sistema de Contabilidade Gerencial: um estudo em empresas têxteis do Estado do Rio Grande do Sul. Revista de Ciências da Administração, 16(38). 196-212. http://dx.doi.org/10.5007/2175-8077.2014v16n38p195
Beuren, I. M., & Söthe, A. (2009). A teoria da legitimidade e o custo político nas evidenciações
contábeis dos governos estaduais da região sudeste do Brasil. Revista de Contabilidade e Organizações, 3(5), 98-120. https://doi.org/10.11606/rco.v3i5.34734
Borges, L.F. X., & Serrão, C. F. B. (2005). Aspectos de governança corporativa moderna no
Brasil. Revista do BNDES, 12(24), 111-148. Recuperado de http://web.bndes.gov.br/bib/jspui/handle/1408/9643
Brignall, S., & Modell, S. (2000). An institutional perspective on performance measurement
and management in the ‘new public sector’. Management Accounting Research, 11(3), 281- 306. https://doi.org/10.1006/mare.2000.0136
Buta, B. O., & Teixeira, M. A. C. (2020). Governança pública em três dimensões: conceitual,
mensural e democrática. Revista Organizações & Sociedade, 27(94), 370-395. https://doi.org/10.1590/1984-9270941
Cadez, S., & Guilding, C. (2008). An exploratory investigation of an integrated contingency
model of strategic management accounting. Accounting, Organizations and Society, 33(7- 8), 836-863. https://doi.org/10.1016/j.aos.2008.01.003
Castro, C. J., & Silva, G. V. (2017). Boas práticas de governança aplicadas ao setor público:
Uma análise na prestação de contas de cinco universidades públicas federais. Revista Espacios, 38(17), 26-48. Recuperado de https://www.revistaespacios.com/a17v38n17/17381726.html
Cavalcante, M. C. N., & Luca, M. M. de M. (2013). Controladoria como instrumento de
governança no setor público. Revista de Educação e Pesquisa em Contabilidade, 7(1), 73- 90. https://doi.org/10.17524/repec.v7i1.138
Cavalcante, P. (2016). Desempenho fiscal e eleições no Brasil: uma análise comparada dos
governos municipais. Revista de Administração Pública, 50(2), 307-330. https://doi.org/10.1590/0034-7612146623
Ceneviva, R., & Farah, M. F. S. (2012). Avaliação, informação e responsabilização no setor
público. Revista de Administração Pública, 46(4), 993-1016. https://doi.org/10.1590/S0034- 76122012000400005
Chan, S-G., & Karim, M. A. Z. (2012). Public spending efficiency and political and economic
factors: evidence from selected East Asian countries. Economic Annals, 57(193), 7-23. http://dx.doi.org/10.2298/EKA1293007C
Chenhall, R. H. (2003). Management control systems design within its organizational context:
findings from contingency-based research and directions for the future. Accounting, Organizations and Society, 28(2-3), 127-168. https://doi.org/10.1016/S0361- 3682(01)00027-7
Covaleski, M. A., Evans, J. H., Luft, J. L., & Shields, M. D. (2003). Budgeting research: three
theoretical perspectives and criteria for selective integration. Journal of Management Accounting Research, 15(1), 3-49. https://doi.org/10.1016/S1751-3243(06)02006-2
Cruz, C. F., Ferreira, A. S., Silva, L. M. & Macedo, M. S. (2012). Transparência da gestão
pública municipal: um estudo a partir dos portais eletrônicos dos maiores municípios brasileiros. Revista de Administração Pública, 46(1), 153-176. https://doi.org/10.1590/S0034-76122012000100008
Cruz, C. F., Silva, L. M., & Santos, R. (2009). Transparência da gestão fiscal: um estudo a partir
dos portais eletrônicos dos maiores municípios do Estado do Rio de Janeiro. Contabilidade, Gestão e Governança, 12(3), 102-115. Recuperado de https://www.revistacgg.org/index.php/contabil/article/view/86
Cucciniello, M., Porumbescu, G. A., Grimmelikhuijsen, S. (2017). 25 years of transparency
research: evidence and future directions. Public Administration Review, 77(1), 32-44. https://doi.org/10.1111/puar.12685
Dias, T., & Cario, S. A. F. (2014). Governança Pública: ensaiando uma concepção. Revista
Contabilidade, Gestão e Governança, 17(3), 89-108. Recuperado de https://www.revistacgg.org/index.php/contabil/article/view/621
Donaldson, L. (2001). The contingency theory of organizations. Thousand Oaks, CA: Sage.
Fagundes, J. A., Petri, M., Lavarda, R. B., Rodrigues, M. R., Lavarda, C. E. F., & Soller, C. C.
(2010). Estrutura organizacional e gestão sob a ótica da teoria da contingência. Gestão & Regionalidade, 26(78), 52-63. https://doi.org/10.13037/gr.vol26n78.792
Farah, M. F. S. (2001). Parcerias, novos arranjos institucionais e políticas públicas no nível
local de governo. Revista de Administração Pública, 35(1), 119-144. Recuperado de https://bibliotecadigital.fgv.br/ojs/index.php/rap/article/view/6364
Farrington, C. (2010). Putting Good Governance into Practice II: Critiquing and Extending the
Ibrahim Index of African Governance. Progress in Development Studies, 10, 81-86. http://dx.doi.org/10.1177/146499340901000106
Fávero, L. P. & Belfiore, P. (2021). Manual de análise de dados. 1. Ed. Reimpr. Rio de Janeiro,
RJ: LTC.
Federal Council of Administration (2021). Índice de Governança Municipal (Municipal
Governance Index). Taken from https://igm.cfa.org.br/
Field, A. (2020). Descobrindo a estatística usando o SPSS. Tradução de Lorí Viali. 5. Ed.
Porto Alegre, RS: Penso.
Fiirst, C., Baldissera, J. F., Martins, E. B., & Nascimento, S. A. A. (2018). A Influência dos
Índices Socioeconômicos e Contábeis no nível de Transparência Eletrônica dos Estados Brasileiros sob a ótica da Teoria da Escolha Pública. Administração Pública e Gestão Social, 10(4), 272-281. https://doi.org/10.21118/apgs.v10i4.5707
Fiirst, C., & Beuren, I. M. (2021). Influência de fatores contingenciais no desempenho
socioeconômico de governos locais. Revista de Administração Pública, 55(6), 1355-1368. https://doi.org/10.1590/0034-76120200827
Fox, J. (2007). The uncertain relationship between transparency and accountability.
Development in Practice, 17(4-5), 663-671. http://dx.doi.org/10.1080/09614520701469955
Freitas, M. M. de, Silva, L. C. da, Vicente, E. F. R., Rosa, F. S. da, & Santos, R. R. dos, (2022).
A Evolução do Conceito de Governança Pública: o futuro tecnológico. Prosppectus – Perspectivas Qualitativas em Contabilidade e Organizações, 2(2), 33-62. Recuperado de https://periodicos.ufpb.br/index.php/prosp/article/view/63997
Fukuyama, F. (2013). What Is Governance? Governance, 26(3), 347-368. https://doi.org/10.1111/gove.12035
Gil, A. C., (2008). Como elaborar projetos de pesquisa. São Paulo, SP: Atlas.
Gisselquist, R. M. (2014). Developing and evaluating governance indexes: 10 questions. Policy
Studies, 35(5), 513-531. https://doi.org/10.1080/01442872.2014.946484
Graaf, G. de, & Asperen, H. van, (2018). The art of good governance: how images from the
past provide inspiration for modern practice. International Review of Administrative Sciences, 84(2), 405-420. https://doi.org/10.1177/0020852316630392
Greenwood, R., & Hinings, C. R. (1976). Contingency theory and public bureaucracies. Policy
& Politics, 5(2), 159-180. https://doi.org/10.1332/030557376782842986
Grindle, M. S. (2010). Good Governance: The Inflation of an Idea. Faculty Research Working
Paper Series, RWP 10-023. Harvard Kennedy School. Recuperado de http://nrs.harvard.edu/urn-3:HUL.InstRepos:4448993
Hair, J. F. Jr, Black, W. C., Babin, B. J., Anderson, R. E., & Tatham, R. L. (2009). Análise
Multivariada de Dados. 4. Ed. Porto Alegre, RS: Bookman.
Hallerberg, M., & Kayser, M. (2013). Measuring Governance. APSA-Comparative Politics
Newsletter, 23(1), 1-2. Recuperado de https://www.comparativepoliticsnewsletter.org/wp- content/uploads/2021/04/2013_winter.pdf
Harttgen, K., & Klasen, S. (2012). A Houselhold-Based Human Development Index. World
Development, 40(5), 878-899. https://doi.org/10.1016/j.worlddev.2011.09.011
Höfling, E. M. (2001). Estado e políticas (públicas) sociais. Cadernos Cedes, 21(55), 30-41.
https://doi.org/10.1590/S0101-32622001000300003
Kormendi, R. C., & Meguire, P. G. (1985). Macroeconomic determinants of growth: cross-
country evidence. Journal of Monetary Economics, 16(2), 141-163. https://doi.org/10.1016/0304-3932(85)90027-3
Lavalle, A. G., & Vera, E. I. (2011). A Trama da crítica democrática: da participação à
representação e à accountability. Lua Nova, 84, 353-364. https://doi.org/10.1590/S0102- 64452011000300005
Macedo, J., & Corbari, E. C. (2009). Efeitos da Lei de Responsabilidade Fiscal no
endividamento dos municípios brasileiros: uma análise de dados em painéis. Revista Contabilidade & Finanças, 20(51), 44-60. https://doi.org/10.1590/S1519- 70772009000300004
Martins, G. A. de, & Domingues, O. (2011). Estatística geral e aplicada. 4. Ed. Rev. e Ampl.
São, Paulo, SP: Atlas.
Matias-Pereira, J. (2010). A governança corporativa aplicada no setor público brasileiro.
Administração Pública e Gestão Social, 2(1), 109-134. https://doi.org/10.21118/apgs.v2i1.4015
Mello, G. R., & Slomski, V. (2010). Índice de governança eletrônica dos estados brasileiros
(2009): No âmbito do Poder Executivo. Journal of Information Systems and Technology Management, 7(2), 375-408. https://doi.org/10.4301/S1807-17752010000200007
Mendes, W. A., Ferreira, M. A. M., Abrantes, L. A., & Faria, E. R. (2018). A influência da
capacidade econômica e da formação de receitas públicas no desenvolvimento humano. Revista de Administração Pública, 52(5), 918-934. https://doi.org/10.1590/0034- 761220170004
Oliveira, A. G., & Pisa, B. J. (2015). IGovP: índice de avaliação de governança pública –
instrumento de planejamento do Estado e de controle social pelo cidadão. Revista de Administração Pública, 49(5), 1263-1290. https://doi.org/10.1590/0034-7612136179
Oliveira, A. S., & Callado, A. A. C. (2018). Fatores Contingenciais e o controle gerencial: uma
avaliação em organizações não governamentais (ONGS) brasileiras. Advances in Scientific and Applied Accounting, 11(1), 92-109. http://dx.doi.org/10.14392/asaa.2018110105
Oliveira, F. B. D., Sant’Anna, A. D. S., & Vaz, S. L. (2010). Liderança no contexto da nova
administração pública: uma análise sob a perspectiva de gestores públicos de Minas Gerais e Rio de Janeiro. Revista de Administração Pública, 44(6), 1453-1475. https://doi.org/10.1590/S0034-76122010000600009
Oman, C. P., & Arndt, C. (2010). Measuring Governance. OECD Development Center Policy
Briefs, 39, OECD Publishing, Paris, France. Recuperado de https://www.oecd.org/dev/46123827.pdf
Otley, D. (1980). The contingency theory of management accounting: achievement and
prognosis. Accounting, Organizations and Society, 5(4), 413-428. https://doi.org/10.1016/0361-3682(80)90040-9
Pace, E. S. U., Basso, L. F., & Silva, M. A. (2003). Indicadores de desempenho com
direcionadores de valor. Revista de Administração Contemporânea, 7(1) 37-65. https://doi.org/10.1590/S1415-65552003000100003
Porporato, M. (2011). Management Control Systems’ literature Development: Theoretical
Approaches and Critiques within the Functionalist Paradigm. Revista Universo Contábil, 7(2), 146-173. http://dx.doi.org/10.4270/ruc.20117
Prajogo, D. I. (2016). The strategic fit between innovation strategies and business environment
in delivering business performance. International Journal of Production Economics, 171(Part 2), 241-249. https://doi.org/10.1016/j.ijpe.2015.07.037
Rabito, D. H. F., Sanches, S. L. R., Carvalho, L. M. C., & Paiva, I. C. de S. (2022). Influence
of contingency factors on the development of smart cities in Brazil. International Journal of Innovation - IJI, 10(4), 696-728. https://doi.org/10.5585/iji.v10i4.21914
Rhodes, R. (2007). Understanding governance: Ten years on. Organization Studies, 28(44),
652-667. https://doi.org/10.1177/0170840607076586
Ronconi, L. (2011). Governança pública: um desafio à democracia. Emancipação, 11(1), 21-
34. https://doi.org/10.5212/Emancipacao.V.11i1.0002
Rose-Ackerman, S. (2017). What does “governance” mean? Governance: An International
Journal of Policy, Administration, and Institutions, 30(1), 23-27. https://doi.org/10.1111/gove.12212
Santos, R. R. dos, & Rover, S. (2019). Influência da governança pública na eficiência da
alocação dos recursos públicos. Revista de Administração Pública, 53(4), 732-752. https://doi.org/10.1590/0034-761220180084
Scarpin, J. E., & Slomski, V. (2007). Estudo dos fatores condicionantes do índice de
desenvolvimento humano nos municípios do estado do Paraná: instrumento de controladoria para a tomada de decisões na gestão governamental. Revista de Administração Pública, 41(5), 909-934. Recuperado de https://bibliotecadigital.fgv.br/ojs/index.php/rap/article/view/6612
Sell, F. F., Beuren, I. M., & Lavarda, C. E. F. (2020). Influência de fatores contingenciais no
desempenho municipal: evidências inferenciais. Revista de Contabilidade e Organizações, 14, e164058. https://doi.org/10.11606/issn.1982-6486.rco.2020.164058
Shapiro, J. M. (2006). Smart cities: Quality of life, productivity, and the growth effects of
human capital. Review of Economics and Statistics, 88(2), 324-335. https://doi.org/10.3386/w11615
Silva, A. R. P. e, Silva, M. C. da, Souza, F. J. V. de, & Silva, J. D. G. da, (2015). Gastos Públicos
na Melhoria da Qualidade de Vida: Avaliação de Funções de Governo dos 40 Municípios Melhores Classificados no IDHM. Revista de Administração e Contabilidade da FAT, 7, 5- 21. Recuperado de https://www.reacfat.com.br/index.php/reac/article/view/112
Silva, J. M. C., Kuwahara, M. Y., & Maciel, V. F. (2012). A eficiência dos gastos municipais
na geração de bem-estar na região metropolitana de São Paulo. RDE – Revista de Desenvolvimento Econômico, 14(26), 86-98. http://dx.doi.org/10.21452/rde.v14i26.1761
Skinner, Q. (1999). Ambrogio Lorenzetti’s Buon Governo Frescoes: Two Old Questions, Two
New Answers. Journal of the Warburg and Courtauld Institutes, 62, 1-28. https://doi.org/10.2307/751381
Teisman, G. R., & Klijn, E. (2008). Complexity Theory and Public Management. Public
Management Review, 10(3), 287-297. http://dx.doi.org/10.1080/14719030802002451
Van de Walle, S. (2005). Measuring bureaucratic quality in governance indicators. Reveu
Française D’Aministration Publique, 115(3), 435-461. https://doi.org/10.3917/rfap.115.0435
Varela, P. S. (2008). Financiamento e Controladoria dos Municípios Paulistas no Setor Saúde:
Uma Avaliação de Eficiência. (Tese de Doutorado). Faculdade de Economia, Administração e Contabilidade, Universidade de São Paulo, São Paulo, Brasil.
Vieira, R. da S. (2009). O Tamanho do Setor Público no Contexto do Federalismo: um modelo
aplicado aos municípios brasileiros. Textos para Discussão, 1415, Instituto de Pesquisa Econômica Aplicada (Ipea). Recuperado de http://repositorio.ipea.gov.br/handle/11058/2599
Wadongo, B., & Abdel-Kader, M. (2014). Contingency theory, performance management and
organisational effectiveness in the third sector: A theoretical framework. International Journal of Productivity and Performance Management, 63(6), 680-703. https://doi.org/10.1108/IJPPM-09-2013-0161
Woods, M. (2009). A contingency theory perspective on the risk management control system
within Birmingham City Council. Management Accounting Research, 20(1), 69-81. https://doi.org/10.1016/j.mar.2008.10.003
Yong, G., & Wenhao, C. (2012). Developing a City Governance Index: Based on Surveys in
Five Major Chinese Cities. Social Indicators Research, 109(2), 305-316. https://doi.org/10.1007/s11205-011-9904-8
i Mestrado em contabilidade pela UEM - Universidade Estadual de Maringá (2022), especialização em MBA em Administração Pública e Gerência de Cidades pelo Centro Universitário Internacional (2019), especialização em MBA em Contabilidade Pública e Responsabilidade Fiscal pelo Centro Universitário Internacional (2016), especialização em MBA Contabilidade Pública pela FIPECAFI - Fundação Instituto de Pesquisas Contábeis, Atuariais e Financeiras (2015), especialização em Perícia Contábil e Auditoria pela UEL - Universidade Estadual de Londrina (2014) e especialização em Animação em Mídias Digitais pela UEL - Universidade Estadual de Londrina (2013). Atualmente é Contador da Câmara Municipal de Arapongas, Estado do Paraná.
ii Mestre em Ciências Contábeis pela Universidade de São Paulo (2002) e Doutor em Ciências Contábeis - área de concentração: Controladoria e Contabilidade pela Universidade de São Paulo (2010). Foi Chefe do Departamento de Ciências Contábeis (2012-2016); Foi Diretor do Centro de Ciências Sociais Aplicadas (CSA) da UEM (2016-2020); Atualmente é Professor e Coordenador do Programa de Pós-Graduação em Ciências Contábeis da UEM – PCO/UEM.