The Impact of SME Collection and Employment in Municipalities in the Metropolitan Region of the State of Rio de Janeiro
O impacto das MPE sobre arrecadação e emprego dos municípios da Região Metropolitana do estado do Rio de Janeiro
Daniel Rodrigues Cordeiro1i*, Orcid: https://orcid.org/0000-0002-3127-7083; Everlam Elias Montibeler2ii, Orcid: https://orcid.org/0000-0001-8899-8669; Sérgio Siqueira da Cruz3iii, Orcid: https://orcid.org/0009-0005-8759-7771; Nicely Soares Gomes4iv, Orcid: https://orcid.org/0009-0000-0545-3533; Beatriz da Costa Oliveira5v, Orcid: https://orcid.org/0009-0000-0772-152X
1. Universidade Iguaçu, Departamento de Administração, Nova Iguaçu, Rio de Janeiro, Brasil. E-mail: danielrodriguesco@gmail.com
2. Universidade Federal do Espírito Santo, Departamento de Economia, Vitória, Espírito Santo, Brasil. E-mail: everlamelias@gmail.com
3. Universidade Iguaçu, Departamentos de Administração/CST em Logística/CST em RH, Nova Iguaçu, Rio de Janeiro, Brasil. E-mail: sergio_siq@hotmail.com
4. Universidade Iguaçu, Departamento de Administração, Nova Iguaçu, Rio de Janeiro, Brasil. E-mail: nicelygomes@gmail.com
5. Universidade Iguaçu, Departamento de Administração, Nova Iguaçu, Rio de Janeiro, Brasil. E-mail: costabia685@gmail.com
Abstract
The goal was to analyze the impact of Small and medium-sized enterprises (SME), opting for the Simple National Tax Regime (SNT), on the Service Tax (ISS) collection and employment in the municipalities of the Metropolitan Region of the State of Rio de Janeiro (MRSRJ). A panel data method was used for the data from 2010 to 2019. The results showed a significant growth in the number of SNT companies in the MRSRJ municipalities and a positive relation between the number of SNT companies and the ISS collection of the MRSRJ municipalities. However, a low positive relation was noted between these companies and the formal jobs they generated. It was concluded that the growth in the number of companies opting for the Simple National is different from the growth of jobs generated by these companies, demonstrating that the role of the Simple National in the formalization of small businesses is greater than its role in job creation.
Keywords: MSE, Simple National; MRSRJ.
Resumo
O objetivo foi analisar o impacto das Micro e Pequenas Empresas (MPE), Optantes pelo Simples Nacional (OPSN), na arrecadação do Imposto Sobre Serviço (ISS) e no emprego dos municípios da Região Metropolitana do Estado do Rio de Janeiro (RMERJ). Utilizou-se o método de dados em painel para os dados de 2010 a 2019. Os resultados demonstraram um crescimento expressivo no número de OPSN nos municípios da RMERJ e uma relação positiva entre o número de empresas OPSN e a arrecadação de ISS dos municípios da RMERJ, porém, notou-se uma relação positiva baixa entre estas empresas e os empregos formais gerados por elas. Concluiu-se que o crescimento do número de empresas que optam pelo Simples Nacional, é diferente do crescimento de empregos gerados por estas empresas, demonstrando que o papel do Simples Nacional com a formalização dos pequenos negócios é maior do que o seu papel na geração de empregos.
Palavras-chave: MPE; Simples Nacional; RMERJ.
Citation: Cordeiro, D. R., Montibeler, Cruz, S. S. da, Gomes, N. S., Oliveira, B. da C. (2024). O impacto das MPE sobre arrecadação e emprego dos municípios da Região Metropolitana do estado do estado do Rio de Janeiro. Gestão & Regionalidade, v. 40, n. Especial: Regionalidade e desenvolvimento: o papel da gestão, e20249143. https//doi.org/10.13037/gr.vol40.e20249143
1 Introduction
Small and medium-sized enterprises (SME), in several countries, represent more than 95% of the country’s businesses. SMEs also hold a vast proportion of the total formal employments and contribute significantly for the national and global economic growth. It is noteworthy that SMEs generate a significant portion of all taxable business revenues in most economies, thus, they are important revenue sources for the State (Moreira, Encarnação, Bispo, Angotti & Colautor, 2013; Organization for Economic Co-operation and Development [OECD], 2015; Quelhas, 2019; Gonda, Gorgenyi-Hegyes, Nathan & Fekete-Farkas, 2020; Pereira, Nandakumar, Sahasranaman, Bamel, Malik & Temouri, 2022).
The SMEs are known for effective contribution to the Gross Domestic Product (GDP), its capacity of generating employment and, consequently, its ability to reduce informal work (Lima, Santos & Paranaiba, 2019). SMEs have been dominating the world scene since 1980, due to major economic, technological and social transformations (Albuquerque, 2013; Sampaio & Marques, 2015; Pessôa, Costa & Maccari, 2016). According to Brazilian Support Service for Micro and Small Businesses (SEBRAE, 2017), the participation of small businesses on the brazilian GDP of 2011 was 27% in accordance with the Ministry of Economy (2020), this percentage, nowadays, increased to 30%.
In the European economy, the agri-food sector is a fundamental sector of the economy, given that its turnover, in 2017, exceeded 1.09 billion euros, representing 15.4% of all trade in the sector and employed around 4.24 million people. And most companies in this sector are SMEs, which generate a turnover of 629 million euros and 2.8 million jobs (Grau & Reig, 2021). In the same aspects, Tingbani, Salia, Hussain and Alhassan (2023), describe that SMEs have a significant role on the GDP and employment, occupying an important portion of the economy of several countries around the world.
Ferreira, Marcedo, Sant'Anna, Longo and Barone (2011), stresses the existence of SMEs as the sustainable basis of the country's economy, since they generate more employment and income, and for this reason the importance of survival so that economic and social development can occur. SMEs have a social and economic importance and have been demonstrated through several aspects, such as: number of companies they totalize, labour they absorb and qualify, participation in the wage bill, and others (Martins, 2011; Santos, Silva & Neves, 2011).
A different aspect pointed out by Rashid and Ratten (2021) was the ability of SMEs to deal with the complex situations experienced during the COVID-19 pandemic and the ability to anticipate the management of future crises, showing the dynamism and flexibility of these companies in different economic cycles. And this dynamism is relevant, as noted by Betitski, Guenther, Kritikos and Thurik (2022), since macro and microeconomic effects occur in different ways between small and large companies. Small businesses are typically at a disadvantage in their ability to capture the opportunities that crises create. Often limiting itself to just preserving the employability of its staff.
Due to some specific difficulties faced by SMEs, they gain their own policies to support their smaller and differentiated structure from large companies (Day, 2000). This different treatment is necessary because, according to Paes (2014), a disadvantage of SMEs would be the higher proportion of costs compared to medium and large companies, and this disadvantage becomes greater the more complex the legislation.
As demonstrated by Deloitte (2014), SMEs have higher costs related to the tax structure on their revenue, which are 1.72%, compared to medium and large companies, since these have costs of 0.26% and 0.12%, respectively. And the increase in this cost can be explained by the complexity of the country's existing tax legislation. As highlighted by Brazilian Institute of Planning and Taxation (IBPT, 2018), since the creation of the 1988 Federal Constitution, 390.726 tax rules have been published, with only 6.9% of them in force.
Noticing the need to create differentiated treatment for SMEs, some attempts at laws emerged aiming to simplify the daily lives of these companies, thus, according to Cruz, Santos and Lacerda (2012), Schwingel and Rizza (2013), Nascimento, Oliveira, Cavalcante, Santos and Silva (2018), and Gomes, Almeida, Oliveira and Queiroz (2021), Simple National is a simplified taxation system created for companies that fall under the Complementary Law nº 123/06 to have this new tax regime option. It has a more simplified form, through this, the State makes companies leave the informal sector, and the collection of taxes is completely differentiated and made easier for companies that intend to become taxpayers.
Simple National is the tax regime aimed at Microenterprises (ME) and Small Businesses (EPP), the regime allows the unification of eight taxes that are calculated through an effective rate, which is located in the annexes that divide the regime, and it is applied to gross revenue and is collected using a single guide, called the Simple National Collection Document - DAS (Pessôa, Costa & Maccari, 2016; Pinto & Dos Santos, 2019).
Regarding the representation of SMEs in number of jobs and the number of formalized companies around the world, the Brazilian context does not appear to be different. According to SEBRAE (2023), in 2021, SMEs represented 99.0% of establishments and were responsible for more than half of formal jobs (52.0%) and for paying 42.4% of the wage bill in the country.
According to SEBRAE (2023), in 2021, in the state of Rio de Janeiro, SMEs represented 99.6% of establishments, 97.8% (Microenterprise - ME) and 1.8% (Small Enterprise - EPP), and 0.4% (Small and medium-sized enterprises - SMEs), and the distribution of formal jobs in these companies is strongly linked to service (53.1%) and commerce (33.4%), followed by industry (7.7%), civil construction (4.4%), and agriculture (1.4%), in 2021.
According to data from the Federal Revenue of Brazil (RFB, 2021), in this same period, municipalities in the state of Rio de Janeiro collected R$ 948,786,359.07 via companies opting for the Simple National, of which only the municipality of Rio de Janeiro represented 66.2% of the collection, followed by the municipalities of Niterói (6.3%), São Gonçalo (2.4%), Duque de Caxias (2.3%) and Nova Iguaçu (1. 9%), all of these belonging to the Metropolitan Region of the State of Rio de Janeiro (MRSRJ).
Therefore, this work was justified due to the importance of SMEs for the economy of several countries around the world, including Brazil, and sought to collaborate with research that aims to bring more information about these companies, mainly in the regional context of the metropolitan region of the state of Rio de Janeiro. This work had as its research problem the following question: “what is the impact of SMEs on the Collection of Service Tax (ISS) and on employment, in the municipalities of the Metropolitan Region of the State of Rio de Janeiro(MRSRJ). focusing on companies Opting for Simple National (OPSN)?”
Seeking to answer this research problem, the general goal was to analyse the impact of the Collection of Service Tax, (ISS), of the Metropolitan Region of the State of Rio de Janeiro, as well as on the employments, focusing on the Opting for Simple National enterprises.
The contribution of the work was divided into two stages: (i) in the theoretical aspect, the work advanced the SMEs literature with a regional contribution, in the context of municipalities in the metropolitan region of the state of Rio de Janeiro; and (ii) in the empirical aspect, the work advanced in the application of the method as an important tool for evaluating the results of policies aimed at SMEs, with a focus on generating employment and revenue in municipalities.
2 Theorical Framework
The Metropolitan Region of the State of Rio de Janeiro concentrates capital, infrastructure and workforce, in addition to bringing together more than 70% of the state's population. Concentrating most of the state's industries, forming a very diverse industrial park. It also brings together highly specialized services in the financial, commercial, educational and health sectors, as well as public bodies and institutions, etc. (Foundation State Center for Statistics, Research and Training of Public Servants of Rio de Janeiro [CEPERJ], 2020).
Regarding the employment in the state of Rio de Janeiro, based on data from the Annual List of Social Information (RAIS, 2020), the recent trajectory of the Rio de Janeiro labour market could be divided into two moments. The first was from 2010 to 2014, when the balance of jobs in the state went from 4.08 million to 4.64 million, a growth of 13.8%. The second period, which follows the mega events held in the state, begins in 2015, with a downward trajectory and rapid deterioration in the number of jobs, with a loss of more than 600 thousand formal jobs. The stock of jobs in 2019 (4.03 million jobs) fell to the same level as in 2010, despite population growth estimated at 6.9% for the period.
The diagnosis of the fiscal situation of the state of Rio de Janeiro (State Secretariat of Finance of Rio de Janeiro [SEFAZ-RJ], 2021), demonstrated that between 2014 and 2019, the negative variation on formal jobs in the State of Rio de Janeiro - ERJ (-13.0%), was more than three times higher than the national average (-4.1%). This same perception had been pointed out by Sobral (2017; 2019), who highlighted that the absolute variation in the annual average number of employed people in ERJ, in 2016, dropped 176,000 jobs. Emphasizing that the problem in Rio's state economy is a serious situation with worrying social consequences, since the 2nd half of 2016, the unemployment rate was already higher than the national average after more than duplicating in only two years.
Regarding employment generation in the ERJ, Silva, Cabral and Cabral (2016), demonstrate that the sectors that generate the most jobs in Rio de Janeiro, resulting from variations in final demand are: commerce; diverse industries; textile, clothing and footwear; machines and equipment; government and public services. However, these sectors have low linkages in the economy of Rio de Janeiro. At the other end, the sectors that presented the lowest simple employment multipliers were the following sectors: electricity; petroleum and coke refining, and mining. This result demonstrates that the productive structure of the ERJ is concentrated in capital-intensive sectors which, in turn, are not capable of promoting the creation of direct jobs in the ERJ.
Analysing the productive structure of Rio de Janeiro, one can observe the high number of activities that are not very inductive, which is aggravated by the absence of consolidated inductive hubs that can resize the state's protagonism in the context of the national productive structure. This harsh reality is reinforced by the process of dismantling important links in the production chain, leading to a worsening of the industrial production fabric and consequently the job market. Table 1 presents MRSRJ's Locational Quotients in relation to the state of Rio de Janeiro, with inductors having a locational quotient greater than 1 and those inducted having a locational quotient lower than 1.
Table 1
Locational Quocient of the Metropolitan Region of the Estate of Rio de Janeiro (MRSRJ)
|
Sector |
Metropolitan Region of the Estate of Rio de Janeiro (MRSRJ) |
% total |
RJ |
% total |
Locational Quotient |
Sector |
|
1 – Mineral Extraction |
11.925 |
0,39% |
37.434 |
0,93% |
0,421 |
Induced |
|
2 – Transformation Industry |
224.188 |
7,33% |
361.165 |
8,94% |
0,819 |
Induced |
|
3 – Industrial Services of Public Utilities |
46.962 |
1,54% |
56.478 |
1,40% |
1,098 |
Inductor |
|
4 - Civil Construction |
116.629 |
3,81% |
163.803 |
4,06% |
0,940 |
Induced |
|
5 - Commerce |
616.277 |
20,15% |
822.657 |
20,37% |
0,989 |
Induzido |
|
6 - Services |
1.510.300 |
49,37% |
1.834.615 |
45,43% |
1,087 |
Inductor |
|
7 – Public Administration |
528.715 |
17,28% |
739.884 |
18,32% |
0,943 |
Induced |
|
8 - Agriculture, Plant Extraction, Hunt and Fishing |
4.145 |
0,14% |
22.413 |
0,55% |
0,244 |
Induced |
|
Total |
3.059.141 |
75,75% |
4.038.449 |
100,00% |
- |
- |
Note: This table demonstrates the locational quotient of the metropolitan region of the State of Rio de Janeiro, which identifies whether the sector is considered “induced” or “inductor” and its proportional representation of MRSRJ. To be considered inductive, the result must be greater than or equal to 1, and results less than 1 are considered induced. The calculations were made based on RAIS data (2020).
It is important to highlight that a higher location quotient does not represent a higher level of employment in a sector, but a greater relative capacity of the sector to generate an impact on the job market. Intending a better understand the job market in Rio de Janeiro, the Locational Quotient of the main region of the state was calculated: the metropolitan region of Rio de Janeiro, which, according to RAIS (2020), in 2019, the region concentrated around 76% of workforce in the state of Rio de Janeiro.
In this regard, the choice of the research object to be SMEs was justified by the findings in the literature, which were mentioned in the introduction, about their relevance in the global context, both in terms of job creation and revenue; and as for the choice of geographical area to be MRSRJ, it was also due to its relevance within the state of Rio de Janeiro, which was demonstrated in the theoretical framework.
Therefore, the works that provided the basis for the proposed hypotheses were: Kalume, Corseuil and Santos (2013), who observed that in the state of Rio de Janeiro, Simple National contributed to the opening of companies or the resumption of definitive activity of those which remained inactive. And the increase in the number of companies that opted for Simple National and the increase in tax revenue caused by these companies was also observed by the authors Paes (2014; 2015), Wilbert, Alcântara and Serrano (2015).
Other works that provided the basis were: the report Federal Senate (2017), which demonstrated that at the beginning of the Simple National public policy, there were around 2.5 million formalized small businesses, and by October 2017 this number had risen to approximately 12.5 million. Cordeiro, Montibeler and Oliveira (2020), demonstrated that the public policy of Simple National contributed positively to the collection of ICMS in Brazilian states, both through job creation and through the formalization of companies opting for Simple National. In another more recent work by Cordeiro, Montibeler, Fortunato Jr. and Rabelo (2023), it was noted that the results signaled that Simple National is an important instrument for strengthening micro and small businesses, as well as a driver of local development, to the extent that it contributes to improving revenue in ERJ municipalities; greater contribution to revenue than to job creation. Therefore, this article proposed the following two hypotheses:
To meet the objective of the research, the methodological procedures were divided into: (i) research sample and (ii) linear regression. In this first point, the sample used in the research was explained, and how the data from this sample were collected; and in the second point, the data analysis technique applied in this research was explained.
3 Method
3.1 Research Sample
When determining the sample, the municipalities of MRSRJ were selected, with a total of 22 municipalities. This limitation in the sample size was because this region concentrates most of the economic activities in the state of Rio de Janeiro. The period covered by this research was from 2013 to 2020, for the first equation (OPSN x Collection) and from 2010 to 2019, for the second equation (OPSN x Employment), since the data referring to the number of Optors of the Simple National (one of the variables used in the work) only began to be made available from this initial date, and the end date is the most recent consolidated number referring to the ISS collection number of these companies (another variable used in the work). To solve the problem of outliers in the sample, adjustments were made to the model by weighting the weights in data with extreme values (MQP model, explained later).
The data relating to these municipalities in the sample were taken from the Brazilian Federal Revenue database, on the Simple National portal, in the statistics tab, in the option “number of opters – Simple National (including SIMEI)”, which helped to compose the independent variable of work, and in SICONFI/FINBRA, in the option “consultations > annual accounts”, which helped composing the dependent variable of model 1. Another database used was that of the Ministry of Economy, on the RAIS Portal, to obtain “data relating to employment”, which made up the other dependent variable used in model 2, since the work used two regression models, the first with an annual data structure (8 periods) and the second with a monthly structure of data. data (120 periods). Finally, information about the population (control variable) was extracted from the CIDADES/IBGE portal.
3.2 Linear Regression with Panel Data
The choice of the method used in this work was due to its relevance and connection with the objective of the present work. Furthermore, other works that sought to study related topics also used this same method, such as the case of Yerrabati (2021), which aimed to examine the non-linear relation between self-employment and economic growth, in the context of developing countries. Following in the wake of self-employment, Cowling and Wooden (2021), examined the extent to which individual self-employment served as a vehicle for job creation. Pacheco, Silva and Castro (2020) estimated the impacts of the main conditional and unconditional transfers on the tax collection of 5,570 Brazilian municipalities. And Silva, Oliveira, Vasconcelos and Fontelene (2019), analyse the effects of municipal revenue on the socioeconomic development of municipalities in Ceará.
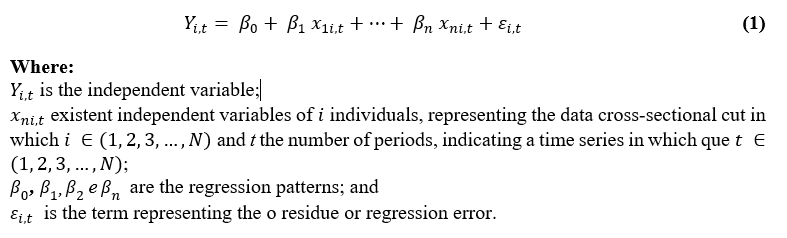
Regression analysis aims to measure the dependence of a variable (variable to be explained) in relation to one or more independent variables (explanatory variables), whose objective is to estimate and/or predict the behavior of the object under study. In Hair Jr., Anderson, Tatham and Black (2005), it appears that a simple linear regression model uses only one independent variable, and these models can be classified into time series regressions, cross-sectional regressions or panel data. The latter has two subclassifications, those of time and individuals, as demonstrated in Equation (1):
According to Hsiao (2014), one of the main advantages of panel data analysis is the use of a greater amount of information, the reduction of collinearity problems and the increase in estimation efficiency. The union of time series and cross section increases the degree of freedom of the sample, that is, it increases the number of observations in relation to the number of parameters that we seek to estimate. The larger the sample size, the greater the degree of freedom and, therefore, the better the result of estimating the parameter values. Therefore, the equations of this work could be represented by Equations (2 and 3):
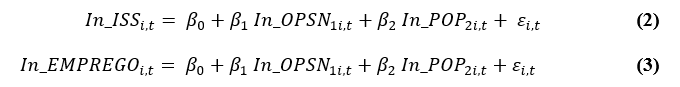
Therefore, the variables in this research were divided as follows: = In_ISS (dependent variable – DV, from model 1), natural logarithm of the municipalities' ISS collection; = In_EMPLOYMENT (dependent variable – DV, from model 2), natural logarithm of jobs created in the municipalities; = In_OPSN (independent variable – IV, from models 1 and 2), natural logarithm of the number of companies opting for Simple National in the municipalities; and = In_POP, natural logarithm of the population of the municipalities (control variable – CV, from models 1 and 2), while the regression coefficients or parameters and , are described by Montgomery , Peck and Vining (2012), as: being the intercept or linear coefficient, which corresponds to the mean of Y when all control variables are equal to zero, that is, it represents the value of Y when X is equal to zero; the coefficient , as partial or angular regression coefficients.
For this study, i indicated the municipalities of MRSRJ, is the intercept that is represented by a scalar variable and which is fixed in time (predictable, non-random value), , the angular coefficients (or parameters) that were tested and is the variable Opting for Simple National (In_OPSN) and is the Municipal Population variable in natural logarithm (In_POP), which vary depending on time t of the years studied and in each municipality i of MRSRJ and is the unobservable value of the specified individual effect.
Table 2
Summary of the variables used in this work.
|
Variable |
Description |
Theorical base |
|
In_ISS (dependent to model 1) |
Variable that describes MRSRJ's ISS collection, in natural logarithm, referring to companies opting for Simple National. |
Paes (2014); Alcântara e Serrano (2015); Cordeiro, Montibeler e Oliveira (2020); Cordeiro et al. (2023). |
|
In_EMPLOYEMENT (dependent to model 2) |
Variable that describes the employment of companies opting for Simple National, in the MRSRJ municipalities, in natural logarithm. |
Castro (2010); Paes (2015); Cordeiro, Montibeler e Oliveira (2020); Cordeiro et al. (2023). |
|
In_OPSN (independent to models 1 e 2) |
Variable that describes companies opting for Simple National, in MRSRJ municipalities, in natural logarithm. |
Paes (2015); Kalume, Corseuil e Santos (2013); Cordeiro, Montibeler e Oliveira (2020); Cordeiro et al. (2023). |
|
In_POP (models control 1 e 2) |
Variable that describes the size of the population of MRSRJ municipalities, in natural logarithm. |
Gennari e Messina (2013); Baskaran (2016); Pansani (2018); Acar (2019); Syahrina e Ermawati (2020); Pansani, Serrano e Ferreira (2020); Paz, Serrano e Ferreira (2020); Dick-Sagoe, Tingum e Asare-Nuamah (2022); Luz et al. (2022). |
Note: Authors cited in the theoretical basis column. The objective of this table is to summarize the variables used in the article's model, as well as to demonstrate their meanings and other works that also used these same variables as a basis.
Two extensions arise from the grouped data model: the fixed effects model and the random effects model. However, the relevant distinction between the two models is not whether the effect ( , is fixed or not, but whether it is correlated with the explanatory variables (REINALDO, 2017). The main difference between the two models is, fundamentally, how each treats unobserved effects. The usual strategy for specifying the fixed or random nature of effects is done by applying the Hausman Test (1978) under the null hypothesis that GLS estimates (random effects) are consistent. If the null hypothesis is rejected, the effects are considered fixed, and the model is estimated using ordinary least squares (OLS). If the null hypothesis is accepted, we would have the case of random effects, and the model would then be estimated by generalized least squares (GLS).
After checking which of the models will be used (fixed or random), other tests must be carried out to verify which one is more suitable, when compared with the model for pooled data. And to do this, there are two other tests: (i) the Breusch-Pagan Test is used to compare the random and pooled effects models, under the null possibility that the variance of the unit-specific error is equal to zero , that is, if the possibility of acceptance is null, the pooled model is preferable to the random effects model; and (ii) the Chow Test is used to compare the fixed and pooled effects models, under the null possibility that there is equality of intercepts and slopes for all individuals (which corresponds to the characteristic of the pooled data model), or In other words, if the null hypothesis is accepted, the pooled model is preferable to the fixed effects model (CHOW, 1960; BREUSCH and PAGAN, 1979; REINALDO, 2017).
Finally, some multivariate analysis techniques, such as linear regression, present a set of assumptions or preassumptions, and the correct application of a statistical procedure depends on compliance with this set of assumptions or assumptions. Therefore, this research sought to highlight the main assumptions required in linear regression analysis.
4 Results and Discussions
Before starting the analysis of linear regression models I and II with panel data, it was necessary to provide some important information through the descriptive statistics shown in Table 3:
Table 3
Descriptive Statistics of Work Variables
|
Variable |
Average |
Median |
D.P. |
Min |
Max |
|
ISS_PerCap |
252,0 |
127,0 |
300,0 |
40,0 |
1,85e+003 |
|
EMP_PerCap |
0,0746 |
0,0612 |
0,0429 |
0,0219 |
0,209 |
|
OPSN_PerCap |
0,0615 |
0,0600 |
0,0181 |
0,0245 |
0,123 |
Note: The results presented above were prepared by the authors, based on research data. The period used in the demonstration above was from 1:1 to 22:8, using as a basis the period determined in model I of the regression. The variables were transformed into per capita.
The variable ISS_PerCap, which represented the average annual collection of the MRSRJ municipalities, presented an average of R$ 252.00 per inhabitant, this average was slightly higher due to the collection of some municipalities having a significant contribution, such as in the municipality of Duque de Caxias, Itaguaí, Niterói, Nova Iguaçu and Rio de Janeiro. The variable EMP_PerCap, which represented the annual average of employment, presented an average of 7.5% of the employed population, an average also impacted, mainly, by the municipalities of Rio de Janeiro and Niterói. The variable OPSN_PerCap, which represented the annual average of the number of people Opting for Simple National, presented an average of 6.1% of the population with companies Opting for Simple National, this average was distributed across the Capital and municipalities of Leste Fluminense and Baixada Fluminense (near Capital region, belonging to MRSRJ).
4.1 Model I Regression Analysis (Collection x Simple National Option)
This first regression analysis sought to verify the effects of the variable Opting for Simple National (OPSN - independent variable), together with the control variable, on the ISS collection of the MRSRJ municipalities (ISS - dependent variable), in the period from 2013 to 2020, counting the 22 individuals in the equation (in this case, the MRSRJ municipalities).
After carrying out the assumption tests, to identify the best model to be adopted in the regression of model I, it was concluded that the most appropriate model for this regression would be using Weighted Least Squares (WLS) instead of Least Squares Ordinary (LOS), to correct the assumption of homoscedasticity.
Table 4
Model I (ISS x OPSN)
|
Model 1: WLS, using 176 observations 22 cross-sectional cut unities included Dependente Variables: In_ISS Weights based on error variances per unit: |
|||||
|
|
Coefficient |
Standart error |
reason-t |
p-value |
|
|
const |
5,66710 |
0,501406 |
11,30 |
<0,0001 |
*** |
|
In_OPSN |
0,876993 |
0,0879104 |
9,976 |
<0,0001 |
*** |
|
In_PoP |
0,642552 |
0,235804 |
2,725 |
0,0071 |
*** |
Estatistics based on weighted data:
|
Sum resid. squares |
173,3044 |
|
E.P. of the regression |
1,000879 |
|
R- squared |
0,921036 |
|
R-ajusted square |
0,920123 |
|
F(2, 173) |
1008,932 |
|
P-value(F) |
4,24e-96 |
|
Likelihood Log |
−248,3749 |
|
Akaike Criterion |
502,7499 |
|
Schwarz Criterion |
512,2613 |
|
Hannan-Quinn Criterion |
506,6077 |
Estatistics based on original data:
|
Dep. var. Average |
17,34718 |
|
D.P. dependent var. |
1,693038 |
|
Sum resid. squares |
118,6741 |
|
E.P. of the regression |
0,828237 |
Note: The results presented above were prepared by the authors, based on research data. As observed in the results of the tests, model I, using the fixed effects model suggested by the Hausman Test (p-value = 7.51037e-124), did not meet some of the assumptions such as the normality of the residuals ( p-value = 1.17253e-151) and homoscedasticity in error variance (p-value = 0), while autocorrelation, the Durbin-Watson Test (1.834799, p-value = 0.74471), demonstrated that there was no first-order autocorrelation between the residuals. To correct the assumption of homoscedasticity of error variance, it was decided to use the replacement of the OLS (Ordinary Least Squares) model with fixed effects by the WLS (Weighted Least Squares) model, which balances the distribution of errors according to the weight of the individuals in the sample. Caption: *90% significance; **95% significance; and ***99% significance.
An important item to analyze in the regression model is the statistical significance of the variables, which is represented by the “p-value” column, and as noted, the variables have a statistical significance of 99%. In this way, it was possible to analyse the relations between the independent and control variable on the dependent variable (OPSN x ISS). Another important item to analyze is the R2 value, which for this first model was 0.9210, that is, it means the variables used can explain 92.10% of the model used.
Regarding the analysis of the regression results, a positive relationship was observed between the two variables, that is, between the number of companies that opted for Simple National and the ISS collection of the MRSRJ municipalities (Table 3), thus confirming the first hypothesis of the work, which was H1: the number of OPSN has a positive relationship with ISS collection in MRSRJ municipalities. And a positive relationship was also observed between population and revenue. Demonstrating that the population also impacts the revenue of municipalities, but to a lesser extent than that of OPSN companies.
This relation between the variables (OPSN x ISS) occurred through the formalization of these companies, which, when formalized, start to issue invoices for their services provided, which causes the triggering event of some taxes on revenue (among them is the ISS), which generates an increase in revenue from municipalities, which are the federal entities responsible for this tax. This increase in the formalization of SMEs was also observed by SEBRAE (2022).
Therefore, the SMEs Opting for Simple National played an important role in collecting ISS from these MRSRJ municipalities. Furthermore, the municipalities benefit doubly from these companies, as, in addition to contributing to the increase in ISS collection via Simple National – which seeks to simplify tax obligations for these companies, and in some cases bring a reduction in the tax burden on revenue, which encourages these companies to formalize – municipalities also collect legalization fees, inspection, opening processes, health inspection, license, garbage collection, etc.
This increase in city halls' own revenue is beneficial for increasing their autonomy, mainly for those that have a high dependence on transfers from the states and the federal government, such as the case of the municipality of Belford Roxo, which, according to data from SICONFI/FINBRA (2020), in 2020, the municipality had a proportion of 82.60% of its current revenues coming from current transfers, unlike the municipality of Rio de Janeiro, which has a lower dependence on transfers, and which in 2020, only 42.06% of its current revenue came from current transfers.
These results referring to encouraging the formalization of companies are in line with the results found by Kalume, Corseuil and Santos (2013), who observed that in the state of Rio de Janeiro, Simple National contributed to the opening of companies or the resumption of activity definitive of those that remained inactive. And the increase in the number of companies that opted for Simple National and the increase in tax revenue caused by these companies was also observed by the authors Paes (2014; 2015), Wilbert, Alcântara and Serrano (2015), Cordeiro (2019) and Cordeiro, Montibeler and Oliveira (2020).
Finally, these positive results were also highlighted in the report prepared by the Economic Affairs Committee of the Federal Senate (2017), in relation to Simple National, highlighting the achievement of one of its objectives, which is the formalization of micro and small companies, which had a growth rate of close to 50% between 2007 and 2017.
4.2 Model II Regression Analysis (Employments x Simple National Option)
After testing the assumptions to identify the best model for regression II, it was concluded that the most appropriate model for this regression would be using Weighted Least Squares (WLS) instead of Ordinary Least Squares (OLS), to correct the assumptions of homoscedasticity and autocorrelation.
Table 5
Model II (EMPLOYMENT x OPSN)
|
Model 2: WLS, using 1562 observations 22 cross-sectional cut units included Variável dependente: In_Emprego |
Wheights based on error variances per unit:
|
|
Coefficient |
Standart Error |
reason-t |
p-value |
|
|
const |
−6,47648 |
0,596481 |
−10,86 |
<0,0001 |
*** |
|
In_OPSN |
0,128326 |
0,0641100 |
2,002 |
0,0455 |
** |
|
In_PoP |
1,89481 |
0,166396 |
11,39 |
<0,0001 |
*** |
Estatistics based on weighted data:
|
Sum resid. squared |
1560,559 |
|
E.P. of the regression |
1,000500 |
|
R-squared |
0,535269 |
|
R-ajusted square |
0,534673 |
|
F(2, 1559) |
897,8151 |
|
P-value(F) |
3,8e-260 |
|
Likelihood Log |
−2215,661 |
|
Akaike Criterion |
4437,322 |
|
Schwarz Criterion |
4453,383 |
|
Hannan-Quinn Criterion |
4443,293 |
Estatistics based on original data:
|
Dep. Var. Avarage |
4,303426 |
|
D.P. dependent var. |
1,646035 |
|
Sum resid. squares |
2022,027 |
|
E.P. of the regression |
1,138860 |
Note: The results presented above were prepared by the authors, based on research data. As observed in the results of the tests, model II, using the fixed effects model suggested by the Hausman Test (p-value = 2.13828e-068), did not meet some of the assumptions such as the normality of the residuals ( p-value = 0), that of homoscedasticity in the error variance (p-value = 0), and that of first-order autocorrelation between the residuals (p-value = 5.20053e-010), since the Test of Durbin-Watson (1.216901), was low. To correct the assumption of homoscedasticity of error variance and first-order autocorrelation, it was decided to use the replacement of the OLS (Ordinary Least Squares) model with the fixed effects by the MQP (Weighted Least Squares) model, which balances the distribution of errors according to the weight of the individuals in the sample. Caption: *90% significance; **95% significance; and ***99% significance.
As mentioned in the previous chapter, an important item to be analysed in a regression model is the statistical significance of the variables, which is represented by the “p-value” column, and as noted, the OPSN variable has a statistical significance of 95%. and the control 99%, since they presented two and three asterisks, respectively.
In this way, it was possible to analyze the relations between the independent variable and the dependent variable (OPSN x EMPLOYMENT). Another important item to analyse is the R2 value, which for this first model was 0.5352, that is, it means that the variables used can explain 53.52% of the model used, demonstrating a very low relation.
Regarding the analysis of the regression results, a low positive relation was observed between the two variables, that is, between the number of companies that opted for Simple National and the number of formal jobs generated by SMEs in the MRSRJ municipalities, thus contradicting the second hypothesis of the work H2: the number of OPSN has a negative relation with the number of jobs generated by SMEs in MRSRJ municipalities. And the positive relation was also observed between population and employment. Demonstrating that the population also impacts employment in municipalities, but, unlike the impact on revenue, these variable impacts employment in a greater proportion than that of OPSN companies.
However, it was observed that the relation, although positive, was very low (see Table 4). This result is in line with the findings of the fiscal diagnosis carried out by SEFAZ-RJ (2021), which demonstrated that between 2014 and 2019, the negative variation in formal jobs in ERJ was -13.0%, being more than three times higher than the national average which was -4.1%. Sobral (2017; 2019), had also signaled a worsening in the state's unemployment rate, which in the second half of 2016 was already higher than the national average. In this way, it demonstrated that the growth in the number of companies opting for Simple National was not enough to stop the decline in the number of formal jobs generated in MRSRJ.
This result is due to most companies Opting for Simple National being Individual Microentrepreneurs (MEI), as demonstrated by the Ministry of Development, Industry, Commerce and Services (2023), MEI is responsible for 57.6% of active businesses in the country, in addition to representing 74.7% of companies opened in the last four months of 2022. According to SEBRAE (2022), 85.4% of companies opened in 2021 in the state of Rio de Janeiro were MEI. And as a limitation, provided for in Complementary Law No. 128/08 (BRASIL, 2008), MEI has the restriction of hiring only a single employee who receives a minimum wage or the minimum wage for the professional category.
Another important data was found by SEBRAE (2022) in the Atlas of Small Businesses, which identified that 87% of Business Owners in Brazil have zero employees, therefore, they are those who work on their own (overseeing the enterprise without employees). And when the proportion of Business Owners who work on their own, by state, was distributed, it was identified that Rio de Janeiro is one of the states with the highest proportion of self-employed MEI, represented by 91%.
These results also demonstrate that the MEI has been playing an important role in the aspect of formalizing individuals, who previously worked informally on their own, and are now seeking formalization for various reasons, including social security benefits (SEBRAE, 2022). Therefore, the growth in the number of OPSN companies is much greater than the growth in the number of jobs generated by these companies, due to this, the relation found was low between the variables OPSN x EMPLOYMENT.
5 Final Considerations
As noted by the authors Moreira, Encarnação, Bispo, Angotti & Colautor, 2013; OECD, 2015; Quelhas, 2019; Gonda, Gorgenyi-Hegyes, Nathan & Fekete-Farkas, 2020; Pereira, Nandakumar, Sahasranaman, Bamel, Malik & Temouri, 2022, in several countries around the world, SMEs represent more than 95% of businesses, generate a significant portion of jobs and contribute to the national and global economy, as well as generating revenue important taxes for the States.
These points could also be observed in the context proposed by this research, with data referring to MRSRJ municipalities from 2010 to 2019 for employment analysis and from 2013 to 2020 for tax collection analysis, where there was a significant growth in the number of companies Opting for Simple National, which is the tax regime used by most SMEs in Brazil, as well as an increase in ISS collection in most of these municipalities studied in the regional context.
By applying the linear regression method, with panel data, a positive relation was verified between the number of companies Opting for Simple National and ISS collection, thus validating the first hypothesis proposed in this research.
And the same positive relation between the number of OPSN companies and the number of jobs generated by SMEs in these municipalities was observed, however, with a low relation, thus contradicting the second hypothesis proposed in this research. This indicates that the growth in the number of OPSN companies is different from the growth in jobs generated by these companies, demonstrating that the role of Simple National in formalizing small businesses is greater than its role in generating jobs.
In this way, the present work answered its research question “What is the impact of SMEs on the collection of Service Tax (ISS) and on employment, in the municipalities of the Metropolitan Region of the State of Rio de Janeiro (MRSRJ), focusing on companies Opting for Simple National (OPSN)?”, thus fulfilling its general objective, and identifying that SMEs are of great importance for ISS collection, however, with a low contribution to generating jobs for the MRSRJ municipalities.
As a contribution, this work highlights the importance and relevance of SMEs for the general economy, as well as at the municipal level, and serves as a basis for other works that will discuss public policies aimed at SMEs and demonstrate the importance of involvement and participation of municipalities in these discussions, since they also benefit from the results of public policies aimed at SMEs. The present study advanced in relation to the methodology applied when compared to other studies about SMEs and Simple National, such as that by Paes (2014) and Wilbert, Alcântara and Serrano (2015).
As a limitation of the research, the number of variables analysed, the time cut-off period and the number of municipalities analysed stood out. And for future research, it is recommended to expand the number of variables, such as municipal GDP, Municipal Development Index and other important variables, as well as the scope of the number of municipalities observed, to verify and compare the results.
References
Acar, Y. (2019). Does Flypaper Effect Exist? New Evidence from Turkish Municipalities. Sosyoekonomi, 27(39), 55-68.
Albuquerque, A. F. (2013). Fatores de mortalidade de pequenas empresas: análise de empresas do setor varejista a partir do ciclo de vida organizacional (Tese de Doutorado). Universidade de São Paulo, São Carlos, SP, Brasil.
Baskaran, T. (2016). Intergovernmental Transfers, Local Fiscal Policy, and the Flypaper Effect: Evidence from a German State. FinanzArchiv/Public Finance Analysis, 72(1), 1-40.
Breusch, T. S.; Pagan, A. R. (1979). A simple test for heteroscedasticity and random coefficient variation. Econometrica, 47(5), 1287-1294.
Belitski, M., Guenther, C., Kritikos, A. S.; Thurik, R. (2022). Economic effects of the COVID-19 pandemic on entrepreneurship and small businesses. Small Business Economics, 58(1), 593-609.
Castro, A. L. (2010). Uma análise de impactos do Simples Nacional no DF. (Dissertação de Mestrado). Universidade de Brasília, Brasília, DF, Brasil.
CEPERJ - Fundação Centro Estadual de Estatísticas Pesquisas e Formação de Servidores Públicos do Estado do Rio de Janeiro (2020, 23 de abril). As oito regiões de Governo e Municípios do Estado do Rio de Janeiro. Recuperado de http://arquivos.proderj.rj.gov.br/sefaz_ceperj_imagens/Arquivos_Ceperj/ceep/informacoes-do-territorio/cartografia-fluminense/Mapa%20das%20Regiões%20de%20Governo%20e%20Municípios%20do%20Estado%20do%20Rio%20de%20Janeiro%20-%202019%20-%20CEPERJ.pdf
Chow, G. C. (1960). Tests of equality between sets of coefficients in two linear regressions. Econometrica, 28(3), 591-605.
Cordeiro, D. R. (2019). O impacto da política pública do Simples Nacional sobre a arrecadação do ICMS. (Dissertação de Mestrado). Universidade Federal Rural do Rio de Janeiro, Seropédica, RJ, Brasil.
Cordeiro, D. R.; Montibeler, E. E.; & De Oliveira, D. R. (2020). O impacto da política pública do Simples Nacional sobre a arrecadação do ICMS. Geosul, 35(76), 580-597.
Cordeiro, D. R., Montibeler, E. E., Fortunato Junior, M. F., & Rabelo, L. das C. (2023). O impacto das MPE optantes pelo simples nacional na arrecadação tributária e na geração de empregos dos municípios do estado do Rio de Janeiro. Revista Econômica Do Nordeste, 54(3), 149–165.
Cowling, M. L.; & Wooden, M. (2021). Does solo self-employment serve as a 'stepping stone' to employership? Labour Economics, 68(101942), 1-12.
Cruz, C. L. R.; Santos, F. S.; & Lacerda, R. S. C. (2012, outubro). Simples Nacional: Um Sistema Tributário Diferenciado. In Anais do VII Congresso Norte Nordeste de Pesquisa e Inovação - CONNEPI, Palmas, TO.
Day, J. (2000). The value and importance of the small firm to the world economy. European Journal of Marketing, 34(9/10), 1033-1037.
Deloitte (2014, 27 de agosto). Compliance tributário no Brasil: as estruturas das empresas para atuar em um ambiente complexo. Recuperado de https://www.joserobertoafonso.com.br/compliance-tributario-no-brasil-deloitte/
Dick-Sagoe, C.; Tingum, E. N. & Asare-Nuamah, P. (2022). Flypaper effects of Central Transfers on the spending behaviour of Ghana’s central region local governments: Does status matter? Masyarakat, Kebudayaan dan Politik, 35(3), 297-309.
Ferreira, C. C.; Macedo, M. A. S.; Sant’Anna, P. R.; Longo, O. C.; & Barone, F. M. (2011). Small business através do panóptico. Revista de Administração Pública - RAP, 45(3), 863-884.
Gennari, E. & Messina, G. (2013). How sticky are local expenditures in Italy? Assessing the relevance of the flypaper effect through municipal data. Int Tax Public Finance. 21(1), 324–344.
Gonda, G.; Gorgenyi-Hegyes, E.; Nathan, R. J.; & Fekete-Farkas, M. (2020). Competitive factors of fashion retail sector with special focus on SMEs. Economies, 8(4), 1-18.
Gomes, A. S.; Almeida, C. R. C.; Oliveira, A. M.; & Queiroz, R. S. (2021). O novo Simples Nacional e sua eficiência na tributação das micro e pequenas empresas: estudo de caso em um escritório contábil. Empreendedorismo, Gestão e Negócios, 10(10), 165-179.
Grau, A.; Reig, A. (2021). Operating leverage and profitability of SMEs: agri-food industry in Europe. Small Business Economics, 57(1), 221-242.
Hair Jr., J. F.; Anderson, R. E.; Tatham, R. L.; & Black, W. C. (2005). Análise multivariada de dados. Porto Alegre, RS: Bookman.
Hausman, J. A. (1978). Specification tests in econometrics. Econometrica, 46(6), 1251-1271.
Hsiao, Ch. (2014). Analysis of Panel Data. Cambridge, UK: Cambridge University Press.
IBPT – Instituto Brasileiro de Planejamento e Tributação (2018, 18 de setembro). Quantidade de Normas Editadas no Brasil: 30 anos da constituição federal de 1988. Recuperado de https://ibpt.com.br/quantidade-de-normas-editadas-no-brasil-30-anos-da-constituicao-federal-de-1988/
Kalume, L. R. V.; Corseuil, C. H. L.; & Santos, D. D. dos. (2013). O Simples Nacional e a formalização das firmas no Rio de Janeiro. IPEA – Planejamento e Políticas Públicas (PPP), 40(1), 277-309.
Lima, M. J. F.; Santos, G. C.; & Paranaiba, A. C. (2019). Análise das Mudanças Ocasionadas na Tributação das Empresas Optantes pelo Simples Nacional. Revista da Micro e Pequena Empresa, 13(1), 33-50.
Martins, E. L. C. (2011). Monitoramento informacional do ambiente de negócios na micro e pequena empresa (MPE): estudo do comércio varejista de materiais para construção de Cuiabá-MT. (Tese de Doutorado). Universidade de Brasília, Brasília, DF, Brasil.
Moreira, R. L.; Encarnação, L. V.; Bispo, O. N. A.; Angotti, M.; & Colauto, R. D. (2013). A importância da informação contábil no processo de tomada de decisão das micro e pequenas empresas. Revista Contemporânea de Contabilidade - RCC, 10(19), 119-140.
Ministério da Economia (2021, 5 de outubro). Governo destaca papel da Micro e Pequena Empresa para a economia do país. Recuperado de https://www.gov.br/economia/pt-br/assuntos/noticias/2020/outubro/governo-destaca-papel-da-micro-e-pequena-empresa-para-a-economia-do-pais
Ministério do Desenvolvimento, Indústria, Comércio e Serviços (2023, 20 de janeiro). Mapa de empresas – boletim do 3º quadrimestr/2022. Recuperado de https://www.gov.br/empresas-e-negocios/pt-br/mapa-de-empresas
Montgomery, D. C.; Peck, E. A.; & Vining, G. G. (2012). Introduction to linear regression analysis. New Jersey, USA: Wiley.
Nascimento, M. B.; Oliveira, A. R.; Cavalcante, A. N. M.; Santos, F. K. G.; & Silva, J. B. (2018, outubro). Simples Nacional: um estudo sobre as mudanças no cenário atual. In Anais do 2º Congresso de Gestão, Negócios e Tecnologia da Informação – CONGENTI, Online.
OCDE – Organização para a Cooperação e Desenvolvimento Econômico (2015). Taxation of SMEs in OECD and G20 Countries. OECD Tax Policy Studies, nº 23. Paris, FR: OECD publishing.
Pacheco, C. P.; Silva, C. G. da.; & Castro, M. A. (2020, dezembro). Efeitos das transferências condicionais e incondicionais sobre a arrecadação tributária dos municípios brasileiros. In Anais do 48º Encontro Nacional de Economia – ANPEC, Online, área 5 – economia do setor público.
Paes, N. L. (2014). Simples Nacional no Brasil: o difícil balanço entre estímulos às pequenas empresas e aos gastos tributários. Nova Economia, 24(3), 541-554.
Paes, N. L. (2015). Reflexos do simples nacional no emprego e na formalização do mercado de trabalho no Brasil. Economía, Sociedad y Territorio, xv(49), 639-663.
Pansani, D. A. (2018). Cálculo de índice de ilusão fiscal a partir de evidências do efeito flypaper e da ilusão causada pela complexidade da estrutura tributária de estados e municípios. (Dissertação de Mestrado), Universidade de Brasília, Brasília, DF.
Pansani, D. A.; Serrano, A. L. M.; Ferreira, L. O. G. (2020). Análise de evidências e causas do efeito flypaper e da ilusão fiscal nos estados e municípios brasileiros. Administração Pública e Gestão Social, 12(3), 1-19.
Paz, R. N.; Serrano, A. L. M.; Ferreira, L. O. G. (2020). Desempenho dos municípios brasileiros: uma análise gerencial da realidade econômica e fiscal por meio do efeito flypaper. Revista Universo Contábil, 16(2), 50-66.
Pereira, V.; Nandakumar, M. K.; Sahasranaman, S.; Bamel, U.; Malik, A.; Temouri, Y. (2022). An exploratory study into emerging market SMEs’ involvement in the circular Economy: Evidence from India’s indigenous Ayurveda industry. Journal of Business Research, 142(1), 188-199.
Pessôa, L. C.; Costa, G.; & Maccari, E. A. (2016). As micros e pequenas empresas, o Simples Nacional e o problema dos créditos de ICMS. DIREITO GV, 12(2), 345-363.
Pinto, R. A.; & dos Santos, W. R. M. (2019). Os novos desafios do Simples Nacional. Gestão & Tecnologia, 1(28), 1-22.
Quelhas, F. C. (2019). Impacto dos investimentos em tecnologia da informação nas variáveis estratégicas organizacionais e no desempenho de micro e pequenas empresas (MPE). Revista Gestão & Tecnologia, 19(4), 138-164.
Rais – Relação Anual de Informações Sociais (2020, 18 de setembro). Dados de empregos e estabelecimentos. Recuperado de https://bi.mte.gov.br/bgcaged/
Rashid, S. & Ratten, V. (2021). Entrepreneurial ecosystems during COVID-19: the survival of small businesses using dynamic capabilities. World Journal of Entrepreneurship, Management and Sustainable Development, 17 (3), 457-476.
Reinaldo, L. M. (2017). Estimação clássica e bayesiana para dados em painel. 2017. (Dissertação de Mestrado). Universidade de Brasília, Brasília, DF.
RFB – Receita Federal do Brasil (2018). Resolução CGSN nº 140 de 22 de maio de 2018. Dispõe sobre o Regime Especial Unificado de Arrecadação de Tributos e Contribuições devidos pelas Microempresas e Empresas de Pequeno Porte (Simples Nacional). Brasília, DF. Recuperado de http://normas.receita.fazenda.gov.br/sijut2consulta/link.action?idAto=92278
RFB – Receita Federal do Brasil (2020, 11 de agosto). Estatísticas do Simples Nacional. Recuperado de
Sampaio, L. E. T.; & Marques, H. R. (2015). A Importância do Planejamento Tributário nas Micro e Pequenas Empresas. Revista Controle, xiii(1), 199-217.
Santos, L. M.; Silva, G. M.; & Neves, J. A. B. (2011). Risco de Sobrevivência de Micro e Pequenas Empresas Comerciais. Revista de Contabilidade e Organizações, 5(11), 107-124.
Scheingel, I.; & Rizza, G. (2013). Políticas públicas para a formalização das empresas: lei geral das micros e pequenas empresas e iniciativas para desburocratização. Ipea, 1(0), 47-56.
Sebrae – Serviço Brasileiro de Apoio às Micro e Pequenas Empresas (2022, 5 de dezembro). Atlas dos Pequenos Negócios: 2022. Recuperado de https://static.poder360.com.br/2022/07/Atlas-pequenos-negocios-sebrae.pdf
Sebrae – Serviço Brasileiro de Apoio às Micro e Pequenas Empresas (2023, 31 de janeiro). Panorama do emprego nas MPEs: Módulo empregado. Recuperado de https://datasebrae.com.br/wp-content/uploads/2023/02/Resumo-Executivo-Panorama-do-Emprego-nas-MPEs-modulo-empregado.pdf
Sebrae – Serviço Brasileiro de Apoio às Micro e Pequenas Empresas (2023, 31 de janeiro). Os pequenos negócios no Rio de Janeiro. Recuperado de https://datasebrae.com.br/rj/ .
Sefaz-RJ - Secretaria do Estado de Fazenda do Governo do Estado do Rio de Janeiro (2021, 25 de julho). Diagnóstico da situação fiscal - Estado do Rio de Janeiro - entrega 1. Recuperado de http://www.fazenda.rj.gov.br/transparencia/content/conn/UCMServer/uuid/dDocName%3AWCC42000021429
Senado Federal (2017, 5 de dezembro). Relatório de avaliação da política pública do Simples Nacional - regime especial unificado de arrecadação de tributos e contribuições devidos pelas microempresas e empresas de pequeno porte. Recuperado de https://www12.senado.leg.br/noticias/arquivos/2017/12/05/relatorio
Siconfi/Finbra – Sistema de Informações Contábeis e Fiscais do Setor Público Brasileiro/Finanças do Brasil (2020, 18 de setembro). Consulta contas anuais. Recuperado de https://siconfi.tesouro.gov.br/siconfi/pages/public/consulta_finbra/finbra_list.jsf
Silva, T. M. K. da. Cabral, J. de A.; & Cabral, M. V. de F. (2016). Estrutura produtiva da economia do Estado do Rio de Janeiro: uma análise de insumo-produto. Revista Econômica (UFF), 18(1), 1-27.
Silva, C. R. M. da.; Oliveira, F. A. S.; Vasconcelos, V. D.; & Fontenele, R. E. S. (2019, maio). Arrecadação municipal e desenvolvimento socieconômico nos municípios cearenses. In Anais do VIII Encontro de Administração Pública da ANPAD – EnAPG, UNIFOR, Fortaleza/CE.
Sobral, B. L. B. (2017). Crise no Estado do Rio de Janeiro: diagnóstico e perspectivas. Revista Econômica - Niterói, 19(1), 7-34.
Sobral, B. L. B. (2019). Finanças Públicas Fluminense e tensão federativa: Uma abordagem da crise a partir das especificidades econômicas e do marco de poder. Síntese: Revista da Escola de Contas e Gestão do Tribunal de Contas do Estado do Rio de Janeiro, 13(1), 12-31.
Syahrina, D. & Ermawati (2020). Flypaper Effect Analysis on Local Government Budgets in Indonesia. European Journal of Business and Management Research - EJBMR, 5(4), 1-7.
Tingbani, I.; Salia, S.; Hussain, J. G.; Alhassan, Y. (2023). Environmental Tax, SME Financing Constraint, and Innovation: Evidence From OECD Countries. IEEE Transactions on Engineering Management, 70(3), 1006-25.
Wilbert, M. D.; Alcântara, L. T. de.; & Serrano, A. L. M. (2015). Impactos do Simples na sociedade: uma análise da arrecadação e dos empregos gerados pelas microempresas, empresas de pequeno porte e pelos microempreendedores individuais. Revista Catarinênse da Ciência Contábil – CRCSC, 14(42), 55-69.
Yerrabari, S. (2021). Self-employment and economic growth in developing countries: is more self-employment better? Journal of Economic Studies, Early Acess, 1-15.
---------
Disponibilidade de dados: Não se aplica.
Contribuições dos autores:
i Mestre em Administração pela Universidade Federal Rural do Rio de Janeiro - UFRRJ. Concepção e elaboração do manuscrito. Análise de dados. Elaboração do manuscrito, revisão e aprovação da versão final do trabalho.
ii Doutor em Economia Aplicada pela Universidade Complutense de Madri - UCM. Concepção e elaboração do manuscrito. Elaboração da metodologia. Elaboração do manuscrito, revisão e aprovação da versão final do trabalho.
iii Mestre em Economia Empresarial pela Universidade Cândido Mendes - UCAM. Coleta de dados. Participação ativa da discussão dos resultados. Revisão e aprovação da versão final do trabalho.
iv Bacharel em Administração pela Universidade Iguaçu - UNIG. Coleta de dados. Participação ativa da discussão dos resultados. Revisão e aprovação da versão final do trabalho.
v Bacharel em Administração pela Universidade Iguaçu - UNIG. Coleta de dados. Participação ativa da discussão dos resultados. Revisão e aprovação da versão final do trabalho.
Financiamento: Universidade Iguaçu (UNIG).
Agradecimentos: Agradecimento a Universidade Iguaçu (UNIG), pelas bolsas concedidas pelo Programa de Iniciação Científica (PIC), para as alunas Nicely Soares Gomes e Beatriz da Costa Oliveira.
Aprovação em comitê de ética e obtenção de consentimento informado: Não se aplica.